Showing posts with label data classification. Show all posts

Monday, October 7, 2024

Scale and Resolution Effects on Spatial Data

What a last two weeks it has been this semester. Hurricane Helene threatened the area during the final week of September, shifting everyone's focus to preparation and expected impacts. The storm center passed approximately 90 miles to our west. While coastal impacts were severe, we were spared the brunt inland, even keeping electricity throughout the storm.

Followed that with a preplanned trip for AARoads to Puerto Rico. Then got started on the final module for GIS Special Topics and increased my time investment into the module leading into this past weekend as newly named tropical storm Milton formed in the Bay of Campeche. A Category 5 hurricane as of this writing, Hurricane Milton is expected to make landfall somewhere on the west coast of Florida on Wednesday or Thursday. While wind shear is eventually expected to weaken the storm, unlike Helene, Debby, Idalia and other storms, Milton is forecast to be a major wind event for inland locations. So anxiety levels are high!

The sixth module for GIS Special Topics investigates the effects of scale on vector spatial data and resolution on raster spatial data. The lab also covers spatial data aggregation and the concept of gerrymandering using GIS.

There are multiple meanings of scale to consider for Geographic Information Systems (Zanbergen, 2004).
  • as an indication of the relationship between units on a map and units in the real world. This is typically a representative fraction, which is commonly used with USGS Quads and GIS Maps in general.
  • to indicate the extent of the area of interest. Examples include spatial areas such as neighborhoods, cities, counties and regions.
  • to express the amount of detail or resolution. The resolution of a raster spatial dataset is the cell size, such as 10 meters for the Sentinel 2 blue, green and red spectral bands. This defines the scale of the data.
Scale in the Raster Data Model is straight forward represented by the resolution or cell size. A general rule is that a real world object needs to be at least as large as a cell in order to be recognizable.

Scale in the Vector Data Model also represents the amount of detail. While there is no single best method to express scale in vector data, a good indicator is the size of the smallest polygon or length of the shortest segment of a polyline.

When measuring the length of a complex shape, the total length depends on the smallest unit of the measuring tool. Where the units of a measuring tool decrease, the total length of the shape increases. More nodes and connecting segments result in longer shape lengths or area perimeters. The following images illustrate the differences in scale for the Vector Data Model.
Differing scales of Wake County, NC water flowlines
Water flowline vector data for Wake County, NC in different scales
Polygon vector data for Wake County, NC waterbodies at different scales
Waterbodies vector data for Wake County, NC in different scales

The properties of a Digital Elevation Model (DEM) depends upon what resolution is used. Higher resolution provides more detail. When measuring Slope, values decrease as the cell size increases and detail decreases. Higher detail results in steeper slopes. This effect applies to the full range of slopes regardless of steep areas of terrain (Zanbergen, 2004).
Scatterplot showing the relationship of Resolution vs. Slope in a DEM
Quantification of Resolution vs. Slope for a DEM in lab

The Modifiable Areal Unit Problem (MAUP) factors into deciding what scale to use for analysis of spatial data. MAUP is a complication with statistical analysis when quantifying aerial data. There are two facets of MAUP.

Scale Effect
The optimal spatial scale for analysis is generally not known, as there are multiple scales for analysis to be theoretically considered (Manley 2013). The results of data can be manipulated positively or negatively depending upon upon the size of the aggregation units used.

Zoning Effect
The method used to create areal units. This effect is the result of how spatial data is separated, such as the grouping of smaller areal units into less numbers of larger areal units (Dark & Bram 2007). Changing the grouping can manipulate the results of spatial analysis.

Part 2 of the lab conducting Linear Regression analysis of poverty statistics for Florida in U.S. Census data resulted in an example of MAUP. Different levels of aggregation convey different results:

Linear Regression Results based upon Congressional District

Linear Regression Results based upon Counties

Linear Regression Results based upon Zip Codes

Gerrymandering is the purposeful manipulation of a district shape with intentional bias (Morgan & Evans, 2018) or to affect political power (Levitt, 2010). Partisan gerrymandering takes place when the political party controlling the redistricting process draws district lines to benefit itself and restrict opportunities for opposition parties. While this maneuvering aims to increase inordinately the political power of a group (Levitt, 2010), the U.S. Supreme Court ruled that partisan-focused gerrymandering is not unconstitutional  (Morgan & Evans, 2018).

GIS can measure gerrymandering by the compactness in a number of ways. Compactness is the only common rule pertaining to redestricting that takes into account the geometric shape of the district. A district is considered compact if it has a regular shape where constituents generally live near each other. A circular district is very compact while a linear district is not (Levitt, 2010). 

Thanks to a discussion board post from our classmate Emily Jane, a method for determining compactness that I found easy to interpret is the Reock Score. Using this method, geoprocessing determines the minimum bounding circle around each polygon of a Congressional District. That is the smallest circle that entirely encloses the district. Reock scoring uses the ratio of the district area to the minimum bounding circle with the following equation R=AD/AMBC where AD is the area of the district and AMBC is the area of the minimum bounding circle. The score ranges from 0, which is not compacted, to 1, which is optimally compact.

Example of the Minimum Bounding Circle used with the Reock Score method
An example of the Minimum Bounding Circle around a District polygon for the Reock Score method 

Proceeded with the Reock Score analysis using the Minimum Bounding Geometry tool in ArcGIS Pro. This creates circular polygons for each record in the Congressional District dataset provided. With the minimum bounding circle area variable and the area value of the district, calculated the Reock score for every district. With a field added for the Reock Score, the worst "offenders" of gerrymandering based upon failing to have district 'compactness' from the provided dataset were determined.

Florida District 5 - 2nd worst gerrymandering 'offender'

North Carolina District 2 - the worst gerrymandering 'offender'

References

Zanbergen (2004). DEM Resolution. Vancouver Island University, Nanaimo, BC, Canada.

Manley, D. J. (2013). Scale, Aggregation, and the Modifiable Areal Unit Problem. In Handbook of Regional Science. Springer Verlag.

Dark, S. J., & Bram, D. (2007). The modifiable areal unit problem (MAUP) in physical geography. Progress in physical geography, 31(5), 471-479.

Morgan, J. D., & Evans, J. (2018). Aggregation of spatial entities and legislative redistricting. The geographic information science & technology body of knowledge, 2018(Q3).

Levitt, J. (2010). A Citizen's Guide to Redistricting. New York, NY: Brennan Center for Justice at New York University School of Law.


Thursday, August 1, 2024

Suitability Modeling with GIS

Module 6 for GIS Applications includes four scenarios conducting Suitability and Least-Cost Path and Corridor analysis. Suitability Modeling identifies the most suitable locations based upon a set of criteria. Corridor analysis compiles an array of all the least-cost paths solutions from a single source to all cells within a study area.

For a given scenario, suitability modeling commences with identifying criteria that defines the most suitable locations. Parameters specifying such criteria could include aspects such as percent grade, distance from roads or schools, elevation, etc.

Each criteria next needs to be translated into a map, such as a DEM for elevation. Maps for each criteria are then combined in a meaningful way. Often Boolean logic is applied to criteria maps where suitability is assigned the value of true and non suitable is false. Boolean suitability modeling overlays maps for all criteria and then determines where all criterion is met. The result is a map showing areas suitable versus not suitable.

Another evaluation system in suitability modeling use Scores or Ratings. This scenario expresses criterion as a map showing a range of values from very low suitability to very high, with intervening values in between. Suitability is expressed as a dimensionless score, often by using Map Algebra on associated rasters.

Scenario 1 for lab 6 analyzes a study area in Jackson County, Oregon for the establishment of a conservation area for mountain lions. Four sets of criterion area are specified. Suitable areas must have slopes exceeding 9 degrees, be covered by forest, be located within 2,500 feet of a river and more than 2,500 feet from highways. 

Flow Chart outlining the Suitability Modeling
Flowchart outlining input data and geoprocessing steps.

Working with a raster of landcover, a DEM and polyline feature classes for rivers and highways, we implement Boolean Suitability modeling in Vector. The DEM raster is converted to a slope raster, so that it can be reclassified into a Boolean raster where slopes above 9 feet are assigned the value of 1 (true) and those below 0 (false). The landcover raster is simply reclassified where cells assigned to the forest land use class are true in the Boolean.

Buffers were created on the river and highway feature classes, where areas within 2,500 feet of the river are true for suitability and areas within 2,500 feet of the highway are false for suitability. Once the respective rasters are converted to polygons and the buffer feature classes clipped to the study area, a criteria union is generated using geoprocessing. The suitability is deduced based upon the Boolean values of that feature class and selected by a SQL query to output the final suitability selection.

We repeat this process, but utilizing Boolean Suitability in Raster. Using the Euclidean Distance tool in ArcGIS Pro, buffers for the river and highway feature classes were output as raster files where suitability is assigned the value of 1 for true and 0 for false. Utilized the previously created Boolean rasters for slope and landcover.

Obtaining the suitable selection raster with the four rasters utilizes the Raster Calculator geoprocessing tool. Since the value of 1 is true for suitability in the four rasters, simply adding the cell values for all result in a range of 0 to 4, where 4 equates to fully suitable. The final output was a Boolean where 4 was reclassified as 1 and all other values were assigned NODATA.

Scenario 2 determines the percentage of a land area suitable for development in Jackson County, Oregon. The suitability criteria ranks land areas comprising meadows or agricultural areas as most optimal. Additional criterion includes soil type, slopes of less than 2 degrees, a 1,000 foot buffer from waterways and a location within 1,320 feet of existing roads. Input datasets consist of rasters for elevation and landcover, and feature classes for rivers, roads and soils.

Flowchart showing data input and processes to output a weighted suitability raster
Flowchart of the geoprocessing for Scenario 2

With all five criteria translated into respective maps, we proceed with combining them into a final result. However with Scenario 2, the Weighted Overlay geoprocessing tool is implemented. This tool utilizes a percentage influence on each input raster corresponding to the raster's significance to the criterion. The percentages of each raster input must total 100 and all rasters must be integer-based.

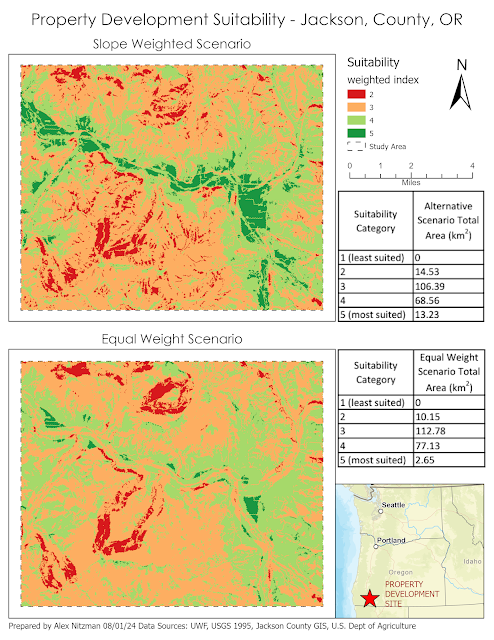
Cell values of each raster are multiplied by their percentage influence and the results compiled in the generation of an output raster. The first scenario evaluated for lab 6 includes an equal weight scenario, where the 5 raster files have the same percentage influence (20%). The second scenario assigned heavier weight to slope (40%) while retaining 20% influence to land cover and soils criterion, and decreasing the percentage influence of road and river criterion to 10%. The final comparison between the two scenarios:

Land Development Suitability Modeling - Jackson County, OR
Opted to symbolize the output rasters using a diverging color scheme from ColorBrewer.

Wednesday, July 24, 2024

Coastal Flooding Analysis - Storm Surge

Module 4 for GIS Applications performs analyses on coastal flooding and storm surge. Storm surge is generally associated with landfalling tropical storms and hurricanes, but it can also be attributed to extratropical storms, such a Nor'easters along the Eastern Seaboard, or powerful winter storms with low barometric pressure and tight wind gradients. Coastal flooding events can also be due to spring tide events based upon the moon's cycle.

Storm surge from Hurricane Idalia inundated Bayshore Boulevard in Tampa, FL
Storm surge inundating Bayshore Boulevard in Tampa during Hurricane Idalia on August 30, 2023.

The first lab assignment revisits Superstorm Sandy, which made landfall as a hurricane transitioning into a powerful extratropical storm along the New Jersey coastline on October 29, 2012. The second and third part of the lab assignment uses Digital Elevation Models (DEMs) to develop scenarios for a generalized storm surge.

The lab analysis on Hurricane Sandy works with LiDAR data covering a barrier island along the Atlantic Ocean between Mantoloking and Point Pleasant Beach, New Jersey. LAS files were downloaded showing the conditions before the storm's impact and afterward.

Initial work in the lab for Module 4 created DEMs by converting the two LAS files to TIN files using geoprocessing in ArcGIS Pro. The TINs were then converted to a raster with a separate geoprocessing tool running upwards of ten minutes.

Comparing the two raster datasets, some pronounced impacts from the hurricane turned extratropical storm were visible. Several datapoints representing structures along the beach were noticeably missing. Additionally a wide breech was cut across the island, with several smaller breeches visible further north. It also appearing that severe scouring of the sand along the coast occurred with a wide area of lower data returns on the post Sandy dataset.

Indicative of the large file size of LiDAR data, when substracting the raster cell values of the post Sandy dataset from the pre Sandy dataset, geoprocessing took 12 minutes and 59 seconds. The result is a raster with values ranging from 33.69 to -35.87. Values toward the high range reflect earlier LiDAR returns, representing the build-up of material, such as sand or debris. Lower values in the change raster indicate later returns, or returns of bare-Earth. This correlates to areas where significant erosion may have occurred or the destruction of a structure.

The change in the the LiDAR pointclouds reveal parcels where homes were destroyed or where the barrier island was breeched by storm surge. The change raster quantifies the amount of change.


LiDAR before Superstorm Sandy

LiDAR showing a major breech caused by Superstorm Sandy

The difference between the two LiDAR pointclouds showing the breech and associated destruction of structures

Recent aerial imagery of Mantoloking, NJ where the breech occurred

The overall impact of Hurricane Sandy on the boroughs of Mantoloking, Bay Head and Point Pleasant Beach in Ocean County, New Jersey:

The raster quantifying the rate of change between the LiDAR datasets before and after Sandy

Output raster using a Boolean

The second analysis for Module 4 utilizes a storm surge DEM for the state of New Jersey. Our task was to reclassify the raster where all cells with values of 2 meters or less constitute areas potentially submerged as a result of Hurricane Sandy. Those cells with values above 2 meters were classified as "no data."

I began the process by adding a new field to the DEM for flooded areas due to storm surge. Cells where the elevation value was equal to or less than 2 were assigning a flood value of 1 for the Boolean of true. All other cells with an elevation value above 2 were assigned 0, for false.

With the added field, I used the Reclassify geoprocessing tool to output a raster of the DEM showing potentially flooded areas versus those at higher ground. The mask was set to the feature class of the New Jersey state outline to exclude areas of the DEM outside of the state that were not needed for our analysis.

Our analysis then focused on Cape May County in South Jersey, where we quantify the percentage of the county potentially inundated with a 2 meter storm surge. The storm surge raster was converted to a polygon and subsequently clipped to the the polygon of the Cape May County boundary.

Another issue encountered was that the storm surge data and county boundary were in different units of measurement. Ended up clipping the storm surge polygon from the county polygon, then comparing the output with the unclipped county boundary for the final percentage. This workaround succeeded as both used the same units.

Clipped feature class of the storm surge polygon over Cape May County, NJ
2-ft storm surge data clipped to Cape May County, NJ

The third analysis for Lab 4 focuses on a potential 1 meter storm surge in Collier County, Florida. Two DEM's are provided, one derived from LiDAR data and another from the regular elevation model from the USGS. Commenced working with this data by reclassifying each DEM to a new raster using a Boolean where any elevation 1 meter or less is considered flooded and anything above is not flooded.

Since we are only interested in storm surge related flooding, any areas shown inland that are entirely disconnected from the tidal basin are omitted from analysis. Accomplished this by using the Region Group geoprocessing tool, where all cells in a raster are reclassified by group and assigned a new ObjectID number.

The Region Group tool takes all of the cells within the hydrologic area of open waters extending into the Gulf of Mexico, and all associated bays and waterways seamlessly feeding into it, and assigns them to a single ObjectID. Similarly, the mainland of Florida is assigned an ObjectID as well. Islands, lakes, ponds, etc. that are independent of one another are also assigned unique ObjectID numbers.
Results of Region Group geoprocessing
Region Group assigns a unique ObjectID for each homogenous area of raster cells. The different colors in this sample from Naples shows separate groups for each land and hydrologic feature based upon the 1 meter elevation threshold
Using the Extract by Attribute geoprocessing tool, selecting the hydrologic area comprising the entire tidal basin is straightforward once the ObjectID number is determined. With that, a new raster comprising just water areas subjected to storm surge is output and subsequently converted to a polygon. The polygon feature class was juxtaposed with a feature class of building footprints for quantitative analysis.

There are a variety of methods in ArcGIS Pro that can be used to determine the number of impacted buildings of a 1 meter storm surge. One such process was to Select by Location based upon the Intersect relationship. This selects records where any part of a building footprint polygon falls within the storm surge raster polygon. Having preadded two fields to the buildings feature class based upon the Boolean of 1 = impacted and 0 = unaffected, with those records selected, used Calculate Field to assign each a value of 1. Repeated the process for both rasters and then proceeded with statistical calculations.

The final analysis quantified whether a building was located within the storm surge zone for the LiDAR based DEM, the USGS based DEM, or both. Errors of omission were calculated where a building was impacted by storm surge in the LiDAR DEM but not the USGS DEM, with that total divided by the overall total number of buildings affected in the LiDAR DEM. Errors of commission were calculated using the opposite and taking that result and dividing it again by the overall total number of buildings affected in the LiDAR DEM. The result tabulates affected buildings by feature type:

Storm surge inundation of areas 1 meter or less in elevation based upon DEMs


Wednesday, July 3, 2024

Crime Analysis in GIS

Our first topic in GIS Applications is crime analysis and the use of crime mapping for determining crime hotspots. Crime mapping techniques provide insight into the spatial and temporal distributions of crime. This benefits criminologists in the research community and professionals in law enforcement.

Crime mapping factors in the importance of local geography as a reason for crime and considers that it may be as important as criminal motivation. The importance of identifying patterns and hotspots in crime mapping tends to be a precursor for implementing effective crime prevention methods.

Fundamental to crime mapping is spatial autocorrelation, which acknowledges the spatial dependency of values measured within areas. This recognizes that crime in one area can influence the crime rate of a nearby area.

We are tasked this week with quantifying data and generating hotspot maps showing crime density using various methods on the clustering of events. The Lab for Module 1 works with crime data for Washington, DC and Chicago.

Kernel Density Map showing crime hotspots for assaults with dangerous weapons in 2018
Output in this week's lab, a kernel density map showing 2018 crime hotspots for Washington, DC

A relative measure, a crime hotspot represents an area with a greater than average frequency of criminal or disorderly events. An area where people have an above average risk of victimization can also be classified as a crime hotspot. Victimization however cannot always be shown on maps, as the theory refers to multiple incidents on the same individual, regardless of location. This can also represent a street (line) or a neighborhood (polygon) where repeat occurrences take place.

Determining crime hotspots can aid in detecting spatial and temporal patterns and trends of crime. The concept can benefit law enforcement in better allocating resources to target areas. Crime hotspots can also be used to identify underlying causes for crime events.

The concept of local clustering, concentrations of high data values, is the most useful for crime analysis. Methods determine where clusters are located and produce a hotspot map showing concentrations.

Point data can be used directly in this analysis of clusters. A collection of points can produce a hotspot whose bounds are derived from the local density of points. Using point data also has the advantage of not being constrained by a predetermined jurisdictional boundary. Data aggregated into meaningful areas, such as within a jurisdiction where the polygons consists of the highest values, can also result in hot spots. Aggregation can produce crime rates, such as the number of events per number of residents or per households for an area.

Aggregated data showing the number of crimes per 1,000 households
Choropleth map with aggregated data determining the crime rate for Washington, DC. 

The Lab for Module 1 focuses on three methods for local clustering. Grid-Based Thematic Mapping overlays a regular grid of polygons above point data of crime events. This produces a count of events for each grid cell. Since all cells are uniform in dimensions, the count is equivalent to a density.

The choropleth map output showing crime density can be further analyzed to determine the crime hotspots. Extracting the crime hotspots involves selecting the highest class of the data. Quintile classification is commonly used to determine this.

The data provided in Lab included point class data of homicides reported in the city of Chicago for 2017. Additionally we were supplied with polygon class data of 1/2 mile grid cells clipped to the Chicago city limits.

The grid cells and point data for Chicago were spatially joined and grid cells where the homicide value was zero were removed from analysis. Using quintile classification, the top 20% of grid cells based on the homicide values was extracted to generate a hotspot map:

Grid-Based Thematic Map of Chicago where three or more homicides were recorded in 2017

Using point values, Kernel Density can also be used to calculate a local density without the use of aggregation. The estimation method utilizes a user-defined grid over the point distribution. A search radius, known as the bandwidth, is applied to each grid cell. Using these two parameters, the method calculates weights for each point within the kernel search radius.

Points closer to the grid cell center are weighted more and therefore contribute more to the total density value of the cell. The final grid cell values are derived by summing the values of all circle surfaces for each location. For the Lab, we used the Spatial Analyst Kernel Density tool in ArcGIS Pro. Input were the grid cell size and bandwidth to run on the 2017 homicides feature class for Chicago. The output was a raster file with ten classes.

Since we were only interested in areas with the highest homicide rate, we reclassified the raster data into two classes. The upper class ranged from a value three times the mean to the maximum value of the raster data. This represented the crime hotspot as estimated with kernel density:

Continuous surface map showing the crime hotspots for Chicago based upon 2017 homicide point data

Local Moran's I is the final method implemented on the 2017 Chicago GIS data for Module 1. A global measure of spatial autocorrelation, the Moran's I method addresses the question, are nearby features similar? Features that are closer to each other are more similar to one another than those located farther apart. Moran's I produces a single statistic that reveals if a spatial pattern is clustered by comparing the value at any one location with the value at all other locations.

The result of Moran's I varies between -1.0 and +1.0. Positive values correlate to positive spatial autocorrelation (clustering) and negative values with negative autocorrelation. Where points that are closer together have similar values, the Moran's I result is high. If the point pattern is random, the value will be close to zero.

For the Lab, the homicides feature class and census tract data were spatially joined. A field calculating the number of homicides per 1,000 units was added. This feature in turn was input into the Cluster and Outlier Analysis (Anselin Local Moran's I) Spatial Statistics tool to output a new feature class based upon Local Moran's I. The result includes attribute data revealing two types of clusters: High-High (HH) representing clusters of high values and Low-low (LL) representing clusters of low values.

High-high clusters in the context of the Chicago crime data represent areas with high homicide values in close proximity to other areas with high homicide values. These are the crime hotspots:

Crime hotspots derived from 2017 homicide data for Chicago using the Local Moran's I method
Sources:

Ratcliffe, J. (2010). Crime Mapping: Spatial and Temporal Changes. Handbook of Quantitative Criminology,. (pp. 5-8).  Springer New York, NY.

Eck, J.E., Chainey, S., Cameron, J.G, Leitner, M. & Wilson, R.E. (2005) Mapping Crime: Understanding Hot Spots. National Institute of Justice (NIJ) Special Report.

Monday, April 15, 2024

Hybrid Mapping - Choropleth and Graduated Symbols

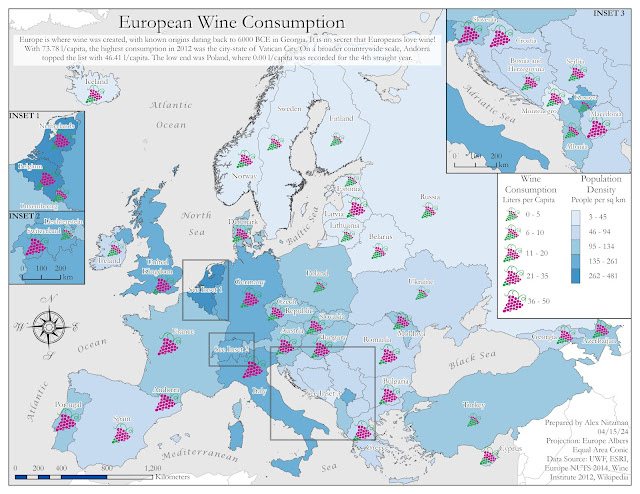
Map showing population density vs wine consumption for European countries

Module 5 for Computer Cartography advances our understanding and usage of choropleth maps while introducing us to proportional and graduated symbol map types.

A choropleth map can be described as a statistical thematic map showing differences in quantitative area data (enumeration units) using color shading or patterns. Choropleth maps are not to be used to map totals, such as ones based on unequal sized areas or unequal sized populations. Instead data should be normalized using ratios, percentages or another comparison measure.

Proportional symbol maps show quantitative differences between mapped features. This is the appropriate map type designed for totals. The map type shows differences on an interval or ratio scale of measurement for numerical data. Symbols are scaled based upon the actual data value (magnitude) occurring at point locations instead of a classification or grouping.

Graduated symbol maps also show quantitative differences in data, but with features grouped into classes of similar values. Differences between features use an interval or ratio scale of measurement. The data classifications use a scheme that reflects the data distribution similar to a choropleth map. Previously discussed data classification methods, such as Equal Interval and Quantile, can be applied to generate classes.

Our lab for Module 5 was the creation of a map dually showing the population density of people per square kilometer and wine consumption at the rate of liter per capita for countries in Europe. A dual choropleth map will display population densities for the continent while a graduated or proportional symbol map will quantify wine consumption rates for each country.

The lab exercise tasks included the creation of both a proportional symbol map and a graduated symbol map of Europe. The ultimate map type used to portray the country data is partly based upon the anticipated ease of a map user to visually interpret the maps.

Generating a proportional map in ArcGIS Pro is a more rigid process with less user options. The scale classifications are preset to five breaks partitioning data into ranges of 20%. However, the feature class labels are not clearly understood, as the range array is 1, 2.5, 5, 7.5 and 10. The minimum size of the symbol proportionally determines the maximum value.

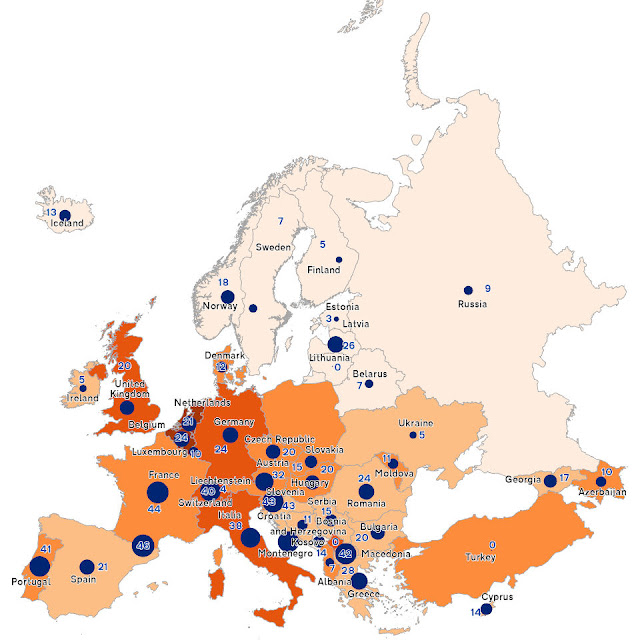
The raw and mostly unstylized output of the Proportional Symbol Map, with arbitrary values showing the rank of counties in wine consumption from lowest to highest, while the sizes convey the actual wine consumption rate of liters per capita:

Proportion Symbol Map of Europe

A graduated symbol map for this assignment provided more flexibility with various methods of classification, more easily understood class separations and automatically generated labels, the ability to adjust classes using Manual Breaks, and absolute control over setting symbol sizes. The final output:

Map showing population density vs wine consumption for European countries

An added aspect of this lab was the introduction of picture symbols, which can be used in place of the default ArcGIS symbol set. Picture symbols allow for more personalized customization to a map, as long as they appropriately distinguish between differences of data magnitude.

Using a blue color palette from the Color Brewer web site, used the Natural Breaks data classification method to generate the choropleth map of European countries by population. The graduated symbol element of the map uses picture symbols that I created in Adobe Illustrator based off the Winery sign specifications used on Florida roads.

Picture Symbols Created for the European Wine Map

The winery icons incorporate a color scheme to aid in visually distinguishing the differences in data magnitude. The highest wine consumption rate equates to the largest symbol size where all grapes in the graphic are colored magenta. The next tier down in order reduces the symbol size by 15% and the proportion of graphics colored magenta versus those shaded green.

A series of three insets were created to better show detail on some of the smaller countries or groups of countries. These required some data exclusion so as not to conflict with data on the main map frame. Prior to creating the insets, I used the Polygon to Point geoprocessing tool to generate a separate point feature class for the graduated symbols. This provided me with the flexibility to relocate the placement of symbols in addition to the option of moving annotated text for the final layout.

The inset creation utilized a definition query with the SQL expression "not including values(s)", where wine consumption data for countries not to be displayed were omitted from the respective inset dataset. The annotation layer for the main map frame was also replicated for each inset to reduce conflict and speed up labeling time.

Chose Garamond font to give a more elegant look to the final map, since the wine is often equated with fine dining or culture. Additionally the blue color palette was specifically selected so as not to contrast with the color of the winery symbols.

Sunday, April 7, 2024

Thematic Mapping - Data Classification Methods

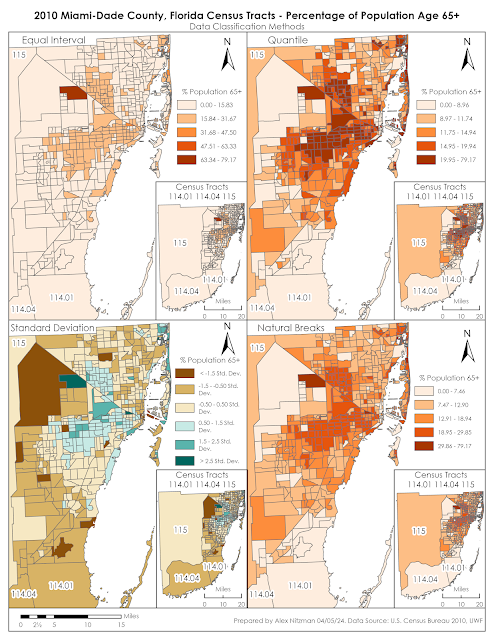
Module 4 for Computer Cartography contrasts 2010 Census Data for Miami-Dade County, Florida using multiple data classification methods. Our objective is to distribute quantitative data into thematic maps based upon two criteria. The first series of maps shows the percentage of the total population per Census Tract of the number of seniors aged 65 and older. The second map array uses normalized data to partition Census Tracts based upon the number of seniors per square mile.

When analyzing data distribution, it is important to understand that many geographical phenomena results in an array of values that can be represented by a bell-shaped curve. This is also referred to as "normal distribution." With normally distributed data, data values further away from the mean are much less frequent than those occurring nearer the mean.

Data classification is a topic that I have limited experience with. This lab required me to do additional research beyond the lectures and the textbook Cartography, to better understand the methods. Based upon online articles read and the course material, the four data classification methods for this lab can be defined as follows.

Equal Interval

The Equal Interval data classification method creates equally sized data classes for a feature layer based upon the range between the lowest and highest values. The number of classes is determined by the user. A simple way to understand this is if there were data with values ranging from 0 to 100, Equal Interval set to 4 classes would create classes with data ranges of 25 for each.

Equal Interval data classification is optimal for continuous datasets where data occurs throughout a geographic area, such as elevation, precipitation or temperature. The method is easily understandable and can be converted manually. However with unequal distribution of data, Equal Interval can result in classes with no data or classes with substantially more data than others.

Quantile

Similar to Equal Interval, the Quantile data classification method results in classes with an equal number of data values, but instead based upon the number records in an attribute table. That is, for a feature layer with 100 records, Quantile classification with five classes partitions the data into classes with 20 records a piece.

Furthermore, identical records cannot be placed in separate classes, nor will empty data classes be created. It also can place similar data values in different classes or very different values in a single class. Adjusting the number of classes can improve upon this.

Quantile data classification is good about showing the relative position of data values, such as where the highest concentration of data is located. It depicts variability, even if there is little within the data.

Standard Deviation

Standard Deviation is the average amount of variability within a dataset from the data mean, or in simpler terms, how spread out are the data values. The Standard Deviation data classification method adds and subtracts the standard deviation from the dataset mean to generate classes. These usually indicate how far data values diverge from the mean.

A disadvantage to implementing Standard Deviation method is that the data needs to be normally distributed. Data Normally distributed has a symmetrical bell shape where the mean and median are equal and both located at the center of the distribution. The empirical rule for normal distribution indicates that 68% of the data is within 1 standard deviation of the mean, 95% is within 2 standard deviations of the mean and 99.7% is within 3 standard deviations of the mean.

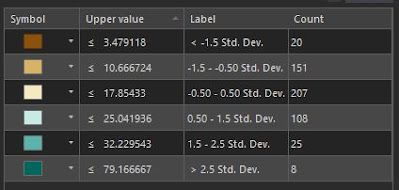
For our lab, the mean of the data for the percentage of seniors within the overall Census Tract population is 14.26%. The standard deviation is 7.19, so 207 of the 519 tracts of Miami-Dade County have senior population rates between 17.85% and 25.04%. The class showing a standard deviation between -1.5 (-10.78%) and -0.5 (-3.59%), shows Census tracts where the senior population makes up between 3.49% and 10.67%, or another 151 tracts of Miami-Dade County. Viewing a thematic map based upon standard deviation reveals where the average number of seniors are located juxtaposed with areas that have less and more than that average.

Miami-Dade Standard Deviation for the percent of seniors per Census Tract


Natural Breaks

The Natural Breaks data classification method separates data into groups where values are minimally different in the same class. Focusing on the natural gaps within a data set, the differences between classes however, are maximized. The aim of Natural Breaks is to determine logical separation points so that naturally occurring clusters are identified.

Natural Breaks works well with unevenly distributed data where values are not skewed toward the end of the distribution The method can still result in classes with a wide range of values. Manually adjusting the break values can be used to offset this or remove the gaps between classes.

A solid grasp of these methods is needed to provide adequate data analysis. Admittedly, I will benefit from further work with creating maps using these data classification methods to better understand their utility.

The Module 4 lab assignment tasks us to make an assessment as to which of the classification methods best displays the data for an audience seeking to market to senior citizens. Further, the lab questions which is the more accurate criteria for data distribution, classifying the population by the percentage of seniors per tract, or using the normalized data where data indicates the number of seniors per area in square miles?

The most accurate display of senior citizen population in Miami-Dade County, Florida is derived from the Natural Breaks data classification method. The thematic map clearly shows the urban areas that represent the highest concentration of the population aged 65 plus. The upper data classes are reserved for just 42 Census tracts while classes showing the mid-range population rate draw the most visual weight.

An audience targeting the senior citizen population may benefit from the Quantile data classification since it shifts the classification scale lower, with 441 seniors per square mile as the starting point for the 2nd class versus 872 seniors per square mile that Natural Breaks generates. This might be a better distribution of the data from an audience stand point.

Miami-Dade County Census Maps showing senior population by area

Having a better understanding of Standard Deviation after writing this blog post, that data classification method adequately shows areas of Miami-Dade County where senior population is below average. The thematic map generally matches the Quantile and Natural Breaks maps in displaying areas of typical and above average senior population.

Which is more preference really depends upon the needs of the end user. A drawback to the Standard Deviation thematic map is that the color pallet for below average senior population tracts dominates the visual aesthetics.

The normalized data based upon the population of seniors per square mile offsets outliers generated by simply using the percentage of seniors per Census Tract. That is because the percent of seniors per tract does not give an indication of how many that number represents. The tract with the highest percentage of seniors represents 95 out of 120 people. Thematic maps for all four data classification maps showed that tract as being the highest concentration of seniors, despite the very rural population statistics:

Thematic maps showing Miami-Dade County Census data based upon the percentage of seniors