Showing posts with label florida. Show all posts

Wednesday, November 20, 2024

GIS Day 2024 Event at FDOT District 7

Following months of planning, of which I contributed starting on the second day of my internship, GIS Day is finally here! Beyond brainstorming ideas in which to better spread the word at FDOT District 7 of the event, I was tasked with creating one or two GIS Day maps for display on the wall of the auditorium.

As the semester progressed, I took inspiration from Special Topics assignments and learned skills from Computer Cartography and GIS Applications for several mapping concepts to share on GIS Day. My idea was to show a few examples of the capabilities of GIS, both from an analytical standpoint, and also in the different ways data can be visualized.

After reading several classmates discussion board posts on presentations they made for GIS Day, I decided to follow their lead and create a presentation of my own. My goal was to provide an overview of maps in GIS, then cover each of the five maps I created with a mix of technical information such as the geoprocessing that went into it or the type of map (choropleth, graduated symbol), principles of design, and inspiration for the map subjects.

Our efforts paid off, and the D7 GIS Department's three hour event this morning was a great success! We had around 30 attendees, many of which stayed for all presentations, and received several positive comments on the event. My presentation went over well and I thoroughly enjoyed sharing some of the GIS knowledge gained from my time with the University of West Florida.
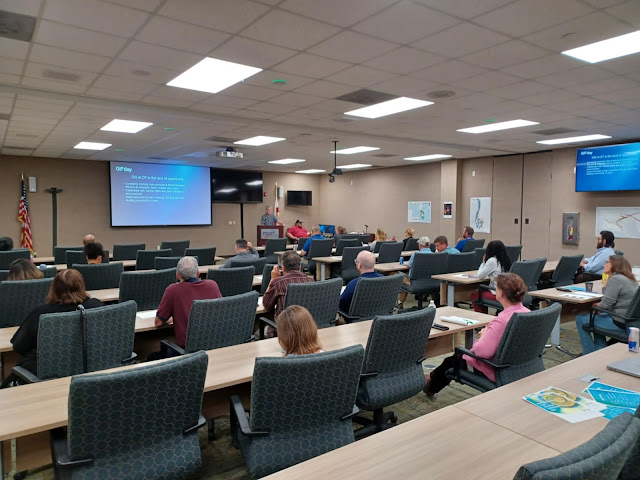
The start of 2024 GIS Day at FDOT District 7
2024 GIS Day at FDOT District 7

My GIS Day 2024 presentation and the maps I created for the event follow:

D7 GIS Day Map Overview

There are two general categories of maps, Reference maps and Thematic maps. We are all familiar with Reference Maps, such as a road map or a political map. On display in the auditorium here are examples of Thematic Maps, which are maps that focus on a specific theme, such as climate, population, or in our case, transportation. This leads me into our first GIS Day map…

Hurricane Tracks Map
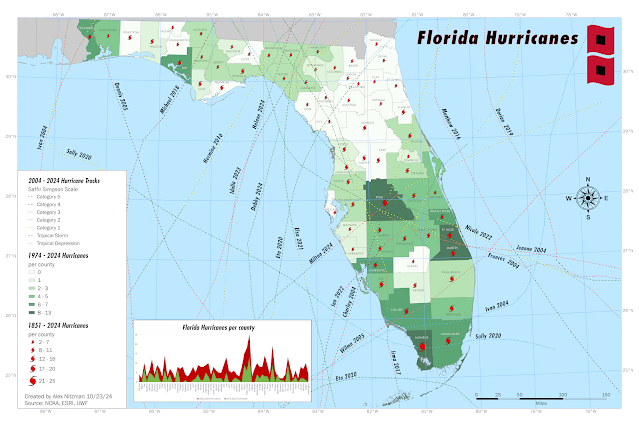
Map quantifying the number of hurricanes striking Florida from 1851 to 2024
Florida Hurricanes quantifying direct impacts from 1851 to 2024

When we were planning our GIS Day event, one of the map concepts discussed was a Florida map of hurricane tracks impacting the state over the last 20 years. Sounds simple enough, but as the map was in production, Hurricane Milton formed, and one fact mentioned by media outlets was that Tampa had not been hit directly by a major hurricane since 1921.

This ultimately factored into me deciding to expand upon the hurricane tracks map concept to quantify the number of hurricanes that have directly passed, the center that is, over each county in the state.

I opted to cover two sets of temporal data. A choropleth map shows the number of hurricanes per county in the last 50 years. It uses dark colors for higher values, conveying that higher values have a heavier visual weight. The graduated symbols map, which quantifies the number of hurricanes per county since 1851, the first Florida hurricane in the dataset, correlate size of the symbol with quantity, i.e. larger means more.

As for how the map was created, the geoprocessing for the choropleth and graduated symbols maps were based upon the number of hurricane polylines crossing any part of the county polygons. These calculations are automatic in GIS and no manual comparisons are needed.

D7 Interstates History Map

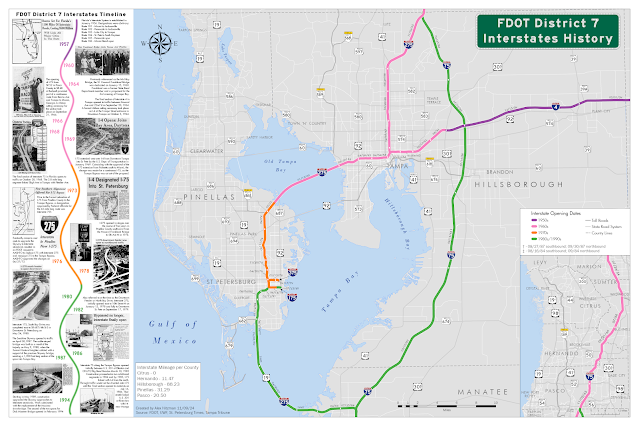
Map showing the opening dates of every mile of the Interstate system within FDOT D7
FDOT District 7 Interstate opening dates color coded by decade

This thematic map aggregates sections of the District 7 Interstate system by the decade in which they opened to traffic. This also shows how the use of graphics can enhance the presentation of a map.

I also factored into the design the Gestalt Principles of Perceptual Organization, which in cartography includes Visual Hierarchy, where important features are emphasized, and less relevant ones deemphasized. The Figure-Ground relationship accentuates certain objects over others by making these appear closer to the map user. Visual Balance is where the size, weight and orientation of map elements are adjusted to achieve balance in the center of the map. Contrast and Color are other principles used in good map design.

D7 Lighting Raster Map

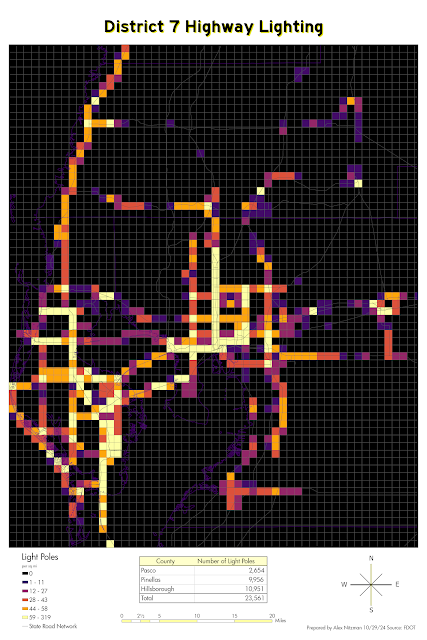
Raster showing the number of light poles per square mile in FDOT District 7
Raster quantifying light poles in FDOT District 7

I created this map to show how raster data can be used by GIS. The concept took the point feature class for all light poles within District 7 and overlayed them with a fishnet grid in ArcGIS Pro. This is also referred to as grid-based thematic mapping. I aggregated the light poles by 1 square mile grid cells and obtained a density unit via geoprocessing. I then symbolized the raster set where lighter colors convey more light fixtures. The end result is a map clearly showing where we maintain the most lighting.

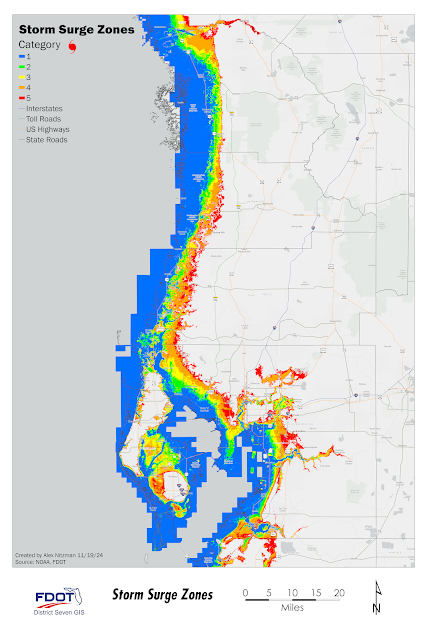
D7 Storm Surge Map

Storm Surge map for FDOT District 7
Areas in FDOT District 7 inundated for storm surge by Saffir-Simpson category

Storm surge data is another form of raster data. These are generally calculated by the use of a Digital Elevation Model or DEM. One useful aspect of ArcGIS Pro is the ability to use geoprocessing to convert a raster into a polygon feature class, such as was done here with this NOAA storm surge dataset.

This expands the options for the GIS analyst. Among others, geoprocessing options include least cost path analysis, buffer analysis, and data interpolation, where unknown values between known data points such as rainfall rates, can be estimated.

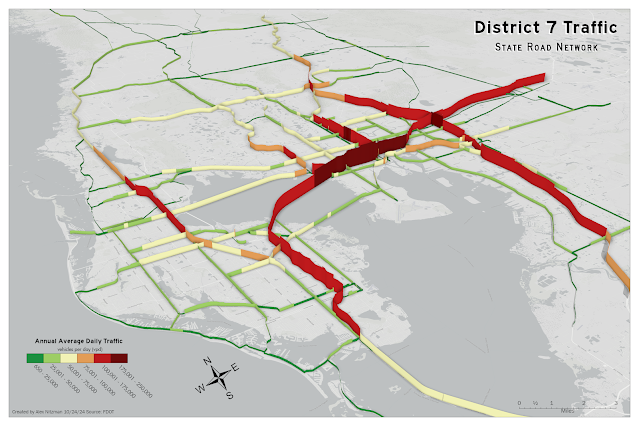
3D Traffic Count Map

3-Dimension map of traffic volume (AADT) for FDOT District 7
3-Dimensional representation of traffic counts (AADT) on the FDOT D7 state road system

When you think of 3D mapping, you probably think of modeling buildings or terrain, but there are several other uses. One such concept of 3D mapping is to visualize 2D data in a different, and perhaps more thought-provoking way.

That was the idea behind this 3D traffic count map of District 7. ArcGIS uses the Extrusion method to add a 3D element to our 2D feature class. Extrusion bases the height of data on a Z-unit, where the unit can be based upon real-world units, such as the height of a building, or upon ranges of data, such as with the traffic counts here.

ArcGIS Pro renders data three dimensionally differently for points, polylines and polygons. Points will appear as columns. Polylines will appear as a wall, as it does here, and Polygons appear as solid objects, which is probably easiest to imagine when applied to a building footprint.

One thing revealed with this 3D traffic count map was that a stretch of traffic count data for Interstate 4 was missing. So, the 3D map produced an unintended benefit, revealing a section of missing data that we could correct.

So, as you can see, GIS allows you to show geospatial data in a more meaningful way. And these maps are only the tip of the iceberg when it comes to the types of deliverables that can be produced.
Wednesday, October 9, 2024

GIS Internship - Training and Hurricanes

The internship with the Florida Department of Transportation (FDOT) at District 7 Headquarters has been quite eventful. I got started a bit later in the semester through the Volunteer Program, so I am approximately one third through the hours for GIS. Beyond mandatory training for state employees, I got started on putting together a training manual for ArcGIS Pro desktop to be used by the GIS Department in future classes for general employees. I also have partaken in weekly GIS Check-in and GIS Day Progress meetings.

Things changed two weeks ago with the expected development of what became Hurricane Helene in the Northwestern Caribbean Sea. From the beginning the projected path focused on the west coast of Florida and Big Bend region. Either way, the counties within District 7 would be affected, so the focus of FDOT shifted from routine day-to-day operations to storm preparation and emergency management applications.

Additionally the office closed for a couple of days and work-from-home was implemented for most employees. Being an intern, that left me waiting until the following week to resume work. But since I am considered an employee, I could still partake in Microsoft Teams communications from my home PC. So I was able to assist in putting together storm surge inundation graphics for upper management using raster data provided in the NHC Data in GIS Formats downloads page.
NHC Storm Surge Inundation Raster Data for Tampa Bay
Potential Storm Surge Inundation for Hurricane Helene with Florida State Roads

Just over a week removed from Hurricane Helene, Tropical Storm Milton quickly formed within the Bay of Campeche over the southwestern Gulf of Mexico. The initial forecast track immediately targeted the Tampa Bay region. So again the focus at FDOT D7 shifted to emergency management operations and storm preparedness. The biggest difference this time was that FDOT played a role in logistics with relocating the massive amount of debris along the Pinellas County coastline that was the result of Hurricane Helene's storm surge.

The office closed again on Tuesday October 8 and remained close through Thursday. This meant my internship was again on hold, but similar to Helene, I could still contribute GIS related graphics from home. Storm surge being the biggest concern again, I put together another storm surge inundation map with GIS data downloaded from the NHC.
NHC raster data for Hurricane Milton storm surge inundation 10/09/24
Hurricane Milton NHC Storm Surge Inundation for Tampa Bay with Florida State Roads

With the knowledge gained from class, I can quantify this data to show the total mileage of Florida State Roads potentially inundated by storm surge. Then by Calculating Statistics, aggregate the percent of state roads effected by county. One thing I have learned thus far with my internship at FDOT is that the turnaround time for producing a deliverable is often very short. Any premade styling or formatting is absolutely necessary and fine tuning an output map is more of a luxury than a necessity.

10/15/24 Update, after 120 hours of no electricity, water or internet due to Hurricane Milton, I finally have the opportunity to created a LinkedIn profile! While I have known about this platform for many years, my internship and recent classes gave me the impetus for making an account.

My approach to setting up the initial profile was to cover as many aspects of my experiences with Geographic Information Systems (GIS) and geography in general. Barring anymore hurricanes and as I get more time, especially as my internship with FDOT progresses, I will further expound upon my GIS work and classes with my profile.

Sunday, September 22, 2024

Interpolation Methods - Tampa Bay Water Quality

There are numerous spatial interpolation methods used to generate surfaces in GIS. This is the prediction of variables at unmeasured locations based upon sampling of similar variables at known locations or true points. Related, spatial prediction is the estimation of variables at unsampled locations based partly on other variables and a collective set of measurements. Comprised of spatially continuous data, surfaces could be topographic, a measure of air pollution, soil moisture, air temperatures and population density among others (Bolstad & Manson, 2022).

A number of factors can affect the performance of spatial interpolation methods. Some of these factors are data accuracy, temporality of the data, sampling design, sample spatial distribution, the presence of abnormal values or outliers, and the correlation of primary and secondary variables (Hu, 1995, Li & Heap, 2014).

Deciding upon the best interpolation method is not always a straight forward process. Methods often work well for a specific data set because of inherent assumptions and algorithm design for estimation. Different interpolations methods applied to the same data set may produce desired results for one study objective but not another (Hu, 1995).

Module 5 for GIS Special Topics performs interpolation analyses for Tampa Bay water quality data. Specifically four methods are used for the estimation of Biochemical Oxygen Demand (BOD) in milligrams per liter variables for Tampa Bay. A point feature class of BOD sample locations is provided and the study area is all of Tampa Bay, Old Tampa Bay and Hillsborough Bay. A statistical analysis of each is compared in an effort to determine which derived surface best describes water quality.

The first interpolation method implemented for the Tampa Bay water quality analysis is Thiessen Polygon. This method was the easiest to interpret. It aggregates the point dataset within the study area to polygons with one per point, which is referred to as a centroid. All estimated points within the Thiessen polygon (proximal zone) are closer in value to the associated centroid than any other centroid in the overall analysis.

The Thiessen Polygon method is optimal when there is no uniform distribution of the sample points. The method is applicable to environmental management (Wrublack et. al, 2013).

Thiessen Polygon interpolation of Tampa Bay water quality
The Thiessen Polygon raster with an output cell size of 250.

Previously discussed in the Isarithmic Mapping lab in Computer Cartography, the Inverse Distance Weighting (IDW) spatial interpolation method estimates values using the values of sample points and the distance to nearby known points (Bolstad & Manson, 2022). Values closer to a location have more weight on the predicted value than those further away. The power parameter in the mathematical equation of the method determines the weighting, which decreases as the distance increases. When the power parameter increases, a heavier weight is applied to nearby samples, which increases their influence on estimation (Ikechukwu, 2017).

The IDW method assumes that the underlying surface is smooth. It works well with regularly spaced data, but cannot account for the spatial clustering of sample points (Li & Heap, 2014).

Tampa Bay water quality estimates from the IDW method
The IDW raster for water quality. The power parameter was 2 and output cell size of 250.

Spline interpolation uses a mathematical function to interpolate a smooth curve along a set of sample data points with minimal curvature. Polynomial functions calculate the segments between join points. These accommodate local adjustments and define the amount of smoothing. The method is named after splines, the flexible ruler cartographers used to fit smooth curves through fixed points (Ikechukwu, 2017).

The performance of Splines improves when dense, regularly-spaced data is used (Li & Heap, 2014). The method is very suitable for estimating densely sampled heights and climatic variables (Ikechukwu, 2017).

The lab uses the options of Regularized and Tension for the Spline geoprocessing tool in ArcGIS Pro. This changes the weight parameter, where higher values in Regularized splines result in smoother surfaces. A weight of zero for the Tension spline option results in a basic thin plate spline interpolation. This is also referenced as the basic minimum curvature technique.

Tampa Bay water quality - Regularized Spline interpolation
Estimated Tampa Bay water quality - Regularized Spline Interpolation Method

Tampa Bay water quality - Tension Spline Interpolation Method
Estimated Tampa Bay water quality - Tension Spline Interpolation Method

References:

Bolstad, B., & Manson, S. (2022). GIS Fundamentals – 7th Edition. Eider Press.

Hu, J. (1995, May). Methods of generating surfaces in environmental GIS applications. In 1995 ESRI user conference proceedings.

Li, J., & Heap, A. D. (2014). Spatial interpolation methods applied in the environmental sciences: A review. Environmental Modelling & Software, 53, 173-189.

Wrublack, S. C., Mercante, E., & Vilas Boas, M. A. (2013). Water quality parameters associated with soil use and occupation features by Thiessen polygons. Journal of Food, Agriculture & Environment, 11(2), 846-853.

Ikechukwu, M. , Ebinne, E. , Idorenyin, U. and Raphael, N. (2017) Accuracy Assessment and Comparative Analysis of IDW, Spline and Kriging in Spatial Interpolation of Landform (Topography): An Experimental Study. Journal of Geographic Information System, 9, 354-371. doi: 10.4236/jgis.2017.93022.

Wednesday, August 28, 2024

GIS Internship - Networking in Tampa

The GIS Internship part of the UWF GIS Certification program is something I have looked forward to since the start of classes last Fall. While working on AARoads is rewarding, the lack of a team to work with, especially in recent years, has been increasingly discouraging. Also my previous work with GIS Cartography and Publishing Services (GISCAPS) is 100% remote, so the interaction there is limited to phone calls. Being able to work with others again and contribute to something meaningful was part of my motivation for returning to college.

Over the years I have gotten know several of the folks working at the Florida Department of Transportation District 7 here in Tampa. Ideally I wanted to work with FDOT as my internship. Unfortunately budget concerns precluded the department from offering a formal internship opportunity. However, the window of opportunity did not fully close with District 7, as thanks to research efforts from my brother in Survey and Mapping, it turns out FDOT does have a formal Volunteer Program.

The objectives of the Volunteer Program "is to enhance the delivery of quality services by promoting community involvement in the Department of Transportation, while providing volunteers with a chance to contribute their valuable time and talents." Compensation was not my goal for an internship, instead I  sought the opportunity to further enhance and expand my GIS skillset. While there were some paperwork issues to address and HR related aspects to iron out, I was approved for the Volunteer Program on August 26!

With my cartography background spanning two decades, I will be provided the opportunity to help out multiple departments at FDOT. Some of my duties outlined for the GIS Volunteer program include learning how to create map services, web maps and web applications, reviewing and providing recommendations for symbology settings for GIS layers, and helping draft a training manual for making maps in ArcGIS Pro according to D7 specifications. I will also get to work with the Survey and Mapping department.

This Fall I also registered to attend the GeoFlo Summit, which takes place on November 14, 2024 in Plant City. This will be the second time I have attended the meeting of GIS Users, but first time as an active GIS User! One of the sponsors of the event is the Tampa Bay GIS Users Group (TBGIS). TBGIS regularly hosts Networking Socials, and the next one takes place this evening in Seminole Heights, Tampa. There is no formal membership to TBGIS and everyone in the GIS community and anyone curious about the geospatial world is welcomed to join any of their events. Social media connections and where to join the TBGIS mailing list is at TBGIS Updates.

Thanks to my work with GISCAPS, I was able to attend the ESRI User Conference in San Diego back in 2014. I also attended the FDOT Symposium in 2019. Those were large-scale events, but the premise was the same, being able to meet with and interact with others in the GIS industry. I chose to focus on  TBGIS because they are local and offer in-person events.

Tampa, the city I call home


Wednesday, July 24, 2024

Coastal Flooding Analysis - Storm Surge

Module 4 for GIS Applications performs analyses on coastal flooding and storm surge. Storm surge is generally associated with landfalling tropical storms and hurricanes, but it can also be attributed to extratropical storms, such a Nor'easters along the Eastern Seaboard, or powerful winter storms with low barometric pressure and tight wind gradients. Coastal flooding events can also be due to spring tide events based upon the moon's cycle.

Storm surge from Hurricane Idalia inundated Bayshore Boulevard in Tampa, FL
Storm surge inundating Bayshore Boulevard in Tampa during Hurricane Idalia on August 30, 2023.

The first lab assignment revisits Superstorm Sandy, which made landfall as a hurricane transitioning into a powerful extratropical storm along the New Jersey coastline on October 29, 2012. The second and third part of the lab assignment uses Digital Elevation Models (DEMs) to develop scenarios for a generalized storm surge.

The lab analysis on Hurricane Sandy works with LiDAR data covering a barrier island along the Atlantic Ocean between Mantoloking and Point Pleasant Beach, New Jersey. LAS files were downloaded showing the conditions before the storm's impact and afterward.

Initial work in the lab for Module 4 created DEMs by converting the two LAS files to TIN files using geoprocessing in ArcGIS Pro. The TINs were then converted to a raster with a separate geoprocessing tool running upwards of ten minutes.

Comparing the two raster datasets, some pronounced impacts from the hurricane turned extratropical storm were visible. Several datapoints representing structures along the beach were noticeably missing. Additionally a wide breech was cut across the island, with several smaller breeches visible further north. It also appearing that severe scouring of the sand along the coast occurred with a wide area of lower data returns on the post Sandy dataset.

Indicative of the large file size of LiDAR data, when substracting the raster cell values of the post Sandy dataset from the pre Sandy dataset, geoprocessing took 12 minutes and 59 seconds. The result is a raster with values ranging from 33.69 to -35.87. Values toward the high range reflect earlier LiDAR returns, representing the build-up of material, such as sand or debris. Lower values in the change raster indicate later returns, or returns of bare-Earth. This correlates to areas where significant erosion may have occurred or the destruction of a structure.

The change in the the LiDAR pointclouds reveal parcels where homes were destroyed or where the barrier island was breeched by storm surge. The change raster quantifies the amount of change.


LiDAR before Superstorm Sandy

LiDAR showing a major breech caused by Superstorm Sandy

The difference between the two LiDAR pointclouds showing the breech and associated destruction of structures

Recent aerial imagery of Mantoloking, NJ where the breech occurred

The overall impact of Hurricane Sandy on the boroughs of Mantoloking, Bay Head and Point Pleasant Beach in Ocean County, New Jersey:

The raster quantifying the rate of change between the LiDAR datasets before and after Sandy

Output raster using a Boolean

The second analysis for Module 4 utilizes a storm surge DEM for the state of New Jersey. Our task was to reclassify the raster where all cells with values of 2 meters or less constitute areas potentially submerged as a result of Hurricane Sandy. Those cells with values above 2 meters were classified as "no data."

I began the process by adding a new field to the DEM for flooded areas due to storm surge. Cells where the elevation value was equal to or less than 2 were assigning a flood value of 1 for the Boolean of true. All other cells with an elevation value above 2 were assigned 0, for false.

With the added field, I used the Reclassify geoprocessing tool to output a raster of the DEM showing potentially flooded areas versus those at higher ground. The mask was set to the feature class of the New Jersey state outline to exclude areas of the DEM outside of the state that were not needed for our analysis.

Our analysis then focused on Cape May County in South Jersey, where we quantify the percentage of the county potentially inundated with a 2 meter storm surge. The storm surge raster was converted to a polygon and subsequently clipped to the the polygon of the Cape May County boundary.

Another issue encountered was that the storm surge data and county boundary were in different units of measurement. Ended up clipping the storm surge polygon from the county polygon, then comparing the output with the unclipped county boundary for the final percentage. This workaround succeeded as both used the same units.

Clipped feature class of the storm surge polygon over Cape May County, NJ
2-ft storm surge data clipped to Cape May County, NJ

The third analysis for Lab 4 focuses on a potential 1 meter storm surge in Collier County, Florida. Two DEM's are provided, one derived from LiDAR data and another from the regular elevation model from the USGS. Commenced working with this data by reclassifying each DEM to a new raster using a Boolean where any elevation 1 meter or less is considered flooded and anything above is not flooded.

Since we are only interested in storm surge related flooding, any areas shown inland that are entirely disconnected from the tidal basin are omitted from analysis. Accomplished this by using the Region Group geoprocessing tool, where all cells in a raster are reclassified by group and assigned a new ObjectID number.

The Region Group tool takes all of the cells within the hydrologic area of open waters extending into the Gulf of Mexico, and all associated bays and waterways seamlessly feeding into it, and assigns them to a single ObjectID. Similarly, the mainland of Florida is assigned an ObjectID as well. Islands, lakes, ponds, etc. that are independent of one another are also assigned unique ObjectID numbers.
Results of Region Group geoprocessing
Region Group assigns a unique ObjectID for each homogenous area of raster cells. The different colors in this sample from Naples shows separate groups for each land and hydrologic feature based upon the 1 meter elevation threshold
Using the Extract by Attribute geoprocessing tool, selecting the hydrologic area comprising the entire tidal basin is straightforward once the ObjectID number is determined. With that, a new raster comprising just water areas subjected to storm surge is output and subsequently converted to a polygon. The polygon feature class was juxtaposed with a feature class of building footprints for quantitative analysis.

There are a variety of methods in ArcGIS Pro that can be used to determine the number of impacted buildings of a 1 meter storm surge. One such process was to Select by Location based upon the Intersect relationship. This selects records where any part of a building footprint polygon falls within the storm surge raster polygon. Having preadded two fields to the buildings feature class based upon the Boolean of 1 = impacted and 0 = unaffected, with those records selected, used Calculate Field to assign each a value of 1. Repeated the process for both rasters and then proceeded with statistical calculations.

The final analysis quantified whether a building was located within the storm surge zone for the LiDAR based DEM, the USGS based DEM, or both. Errors of omission were calculated where a building was impacted by storm surge in the LiDAR DEM but not the USGS DEM, with that total divided by the overall total number of buildings affected in the LiDAR DEM. Errors of commission were calculated using the opposite and taking that result and dividing it again by the overall total number of buildings affected in the LiDAR DEM. The result tabulates affected buildings by feature type:

Storm surge inundation of areas 1 meter or less in elevation based upon DEMs


Monday, April 29, 2024

Google Earth and a Video Tour of Florida Cities

The final module of Computer Cartography returns us to Google Earth to work with KML (Keyhole Markup Language) files and explore some additional functionality of the software. We previously used Google Earth with data collected using ArcGIS Field Maps and a KML file of point data imported from ArcGIS.

The use of KML files with Google Earth allows us to share geographic data with a general audience that may have zero to little GIS expertise or experience. ArcGIS provides a method to convert a feature class to a KML file with the Layer to KML  Geoprocessing Tool. Within ArcGIS Online, it is a simpler process of using the option Export to KML. 

Lecture materials for Module 7 cover several aspects of 3D mapping. The videos showed some of the potential advantages of displaying data in 3D and also with using 3D data for analysis. Examples included showing water consumption data in Merced County, California with space-time cubes, where x,y coordinates represent the location and the z coordinates represent time (years). Classified LiDAR data allows a GIS Analyst to interactively make measurements, such as the height of powerlines or an overpass.

Another function in GIS introduced is animations or fly throughs using 3D data. This is further explored in Lab7 with the use of the 3D Mapping component of Google Earth and the creation of a Tour video covering Florida metropolitan areas and cities from the Suncoast to South Florida.

Outside of what was covered in GIS4043, my previous experience with Google Earth mostly comprised using historical imagery to compare archived air photos with more recent imagery. This week's Lab was somewhat challenging in parsing through the Places folder structure and the Temporary Places folder set added during each Google Earth session.

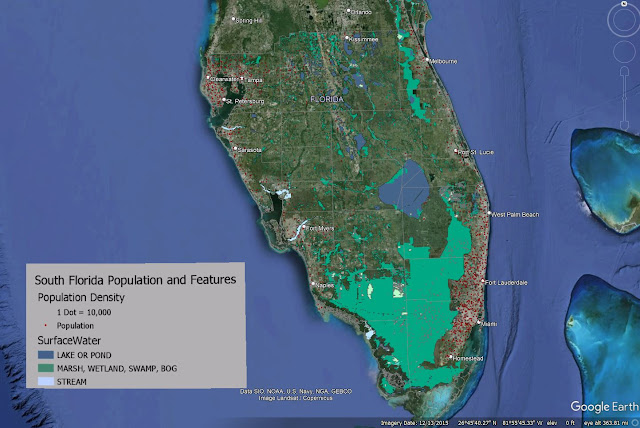
The initial task with the Lab was classifying a provided hydrology feature class and assigning appropriate symbology for water type. This data in turn was converted to a KML for use in Google Earth. Also supplied for the Lab was a Legend .png file and KML files for dot density for population and county boundaries.

All KML files were compiled in Google Earth, but the map legend required manual placement. This was accomplished using the Image Overlay tool, which utilizes a "GroundOverlay" to place an .jpg or .png file. Classmate Michael Lucas made an informative post on the class discussion board about instead creating a  a "ScreenOverlay". I was unsure how to accomplish this and opted to edit the XML of the KML file, changing <GroundOverlay> to <ScreenOverlay>. This was somewhat successful except for that the ScreenOverlay graphic was disproportionately large in context. I discarded it for the final output for Lab.

Screenshot of Google Earth Map covering South Florida hydrology and population density
The KML files and legend used for my Google Earth video tour of South Florida

With the legend in place, our next task was to create an array of bookmarks for various Florida metropolitan areas and city centers. The bookmarks were in turn used as part of a video tour, where Google Earth starts with an overview of southern Florida, and then proceeds to do fly throughs to the places bookmarked. 3D rendering of buildings in Downtowns were included as part of the tour.

Being that I am somewhat of a novice with the controls of Google Earth, I took the suggestion of using some of the keyboard shortcuts to navigate. Keyboard shortcuts are a must for online gaming, and hotkeys are also quite helpful with familiar software applications. However, usage of keyboard shortcuts requires substantial practice to be overall effective with it. As my video showed, I clearly have room for improvement.

The tour ultimately zoomed into the Miami metropolitan area and panned around Downtown Miami before moving north to Fort Lauderdale and then onto the Tampa Bay area. The video showed some choppiness where it appears I went back and forth with the navigation. This may be a drawback with graphics processing or the software, but those effects exaggerated some of my movements.

A visual aspect of the tour allows one to turn on and off layers as desired throughout the course of the video. Other options I explored included changing the speed at which Google Earth zooms in and out, and how responsive the navigation controls are. Clearly, more improvements can be made, but this goes hand and hand with experience.

My Google Earth files for Module 7 are uploaded to Google Drive:

Tuesday, April 2, 2024

Cartographic Design - Gestalt Principles of Perceptual Organization

Module 3 for Computer Cartography builds on Module 2, where we started developing a routine for good map design with guidelines for labeling, annotation and layout text. Building upon that knowledge base, we focus on cartographic design, the method with which maps are conceived and created. The Gestalt Principles of perceptual organization factor into the design process for the Module 3 lab assignment.

There are several key concepts integral to the cartographic design process. Good design should meet the needs of map users and develop maps that are easy to interpret. Maps should be accurate and present data without distortion. Data should be legible and aesthetically pleasing, using either communicative or thought provoking symbols, color, layout and typographic appearance.

The design process focuses on how the data will be reproduced or disseminated. This initial factor helps determine the color scheme, map scale and the file format considered for potential printing methods. Next to strategize is how to classify the data and what symbolization to use. Ranking map elements, emphasizing what is most important and reducing the visual impact of the more irrelevant information contribute to the intellectual hierarchy of the map. The design process is repeated until the map is completed.

Thursday, March 21, 2024

Cartography, Designing a good map

The second module for Computer Cartography expounds upon some of the lessons learned from the first module. These include a refresher of the essential map elements (map title, scale bar, north arrow [orientation], data source information, etc.) from Introduction to GIS (GIS 4043), and general typography principles in cartography ranging from type placement, variation dependent upon features and appropriate type size.

The concept of map clutter from module 1 was again stressed, and the underlining lesson I gained from module 2 is to keep things focused and not add unnecessary details or features. This can be hard for a cartographer, as we often have a tendency to want to use available white space and are picky about what to omit. More on that later.

Supplemental reading for the module provided quite a lot of insight when it comes to map layout and design. The textbook Cartography reaffirmed a lot of what I had learned working for map companies when it came to cartographic design. Specifically text placement, hierarchy of importance and the use of halos and masks for text resonated with me.

Delving further into the textbook, there were several principles that I had not considered so concretely before. When attempting to show the difference in labeling for features ordinally (differences between value or rank), a general guideline is that the optimal difference in height (type size) of the associated features is approximately 25%. Furthermore, avoiding a type size difference of 15% of less should be avoided.

Cartography also references that keeping the same font type for all essential map elements is ideal. It also reiterated from lecture that you should not use the word "Map" in the map title. It furthermore states that a legend should not be titled with the word "Legend" or "Key", as this conveys the obvious. Throughout the maps I have produced for class, I never included "Legend" as the legend title, so I've been on the right track.

The "Type Colour" section in Cartography included a map principle I had not considered before. While text in a legend usually is decorated with black type, an option to introduce color in the type can be useful in providing a connection with the feature itself.

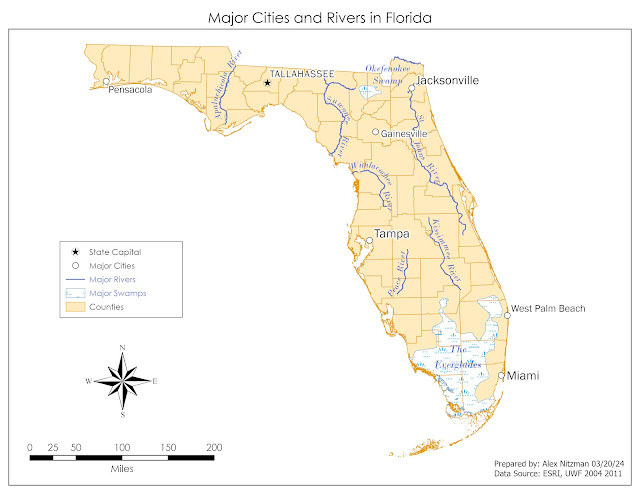
The map to be produced for this week's lab assignment is pretty basic, showing the state of Florida with select majors cities and major rivers. The objective was to place three kinds of text: labels, Annotation and Layout text. Labeling and Layout text were commonly used in previous classes. Annotation however was introduced.
Annotation is a layer where labels are converted to graphic features. They display separately from the features in which they are associated, and can be edited, stylized and repositioned independently of the label class that generated them.

I am not stranger to working with Annotation layers, having previously both output maps for print and web sites using the feature. However, it has been quite some time since I regularly worked with Annotation layers, so my skillset needed a refresher.

Following numerous revisions as I continued to read the textbook, the finalized map:

A very basic map of Florida showing examples of type style and placement

But all that white space! As a cartographer there were times where I was tempted to add a point for Orlando. I also sought to instill a transportation theme, and had actually colored coded the counties by Florida Department of Transportation (FDOT) districts by adding a column to the counties attribute table. There were other map additions that I nearly started, but then rereading the lab instructions and focusing on the British Cartographic Society's Design Group principle "Concept before compilation," where "Think about what the map needs to contain, how it should look, and who is going to read it," I thought better of it. Furthermore we were to make three customizations to the map, not make additions!


Sunday, October 22, 2023

Remote Sensing - Visual Image Interpretation Basics

A short two days following the completion of the Final Project for GIS4043, I am delving into Photo Interpretation and Remote Sensing (GIS4035). The first lab provides an overview on elements of visual image interpretation, with historical black and white air photos of Pensacola Airport and Pensacola Beach in Northwest Florida.

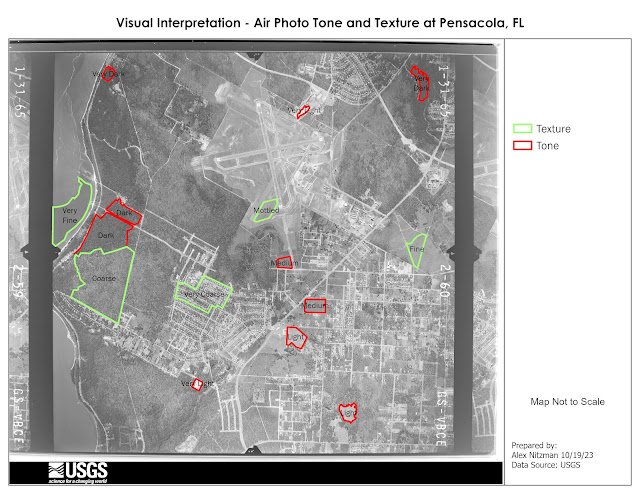
The first aspect of aerial photography interpretation references the tone, or the shades of gray from light/white to dark/black. Referencing the course textbook Remote Sensing of the Environment - An Earth Resource Perspective, tone is a function of the amount of light reflected. Consequently, the greater the absorption of the incident red light by forest stands results in a darker tone.

Large grassy areas, such as those within the Pensacola Airport grounds or for the runway safety areas, appear on the aerial below with a lighter tones. The soil in Escambia County is very sandy, and sand appears in a light tone. Areas by the airport where grading appeared to be underway at the time appear with a very light tone.

Tone and Texture Polygons on a B/W Air Photo
Texture is defined in the course textbook as the characteristic placement and arrangement of repetitions of tone or color in an image. With aerial photography, texture aids in identifying land areas populated by similar groups of objects. The definitions of texture range from fine/smooth, where an area is uniform or homogeneous, to intermediate/mottled, and rough/coarse where the contents of an area are heterogeneous.

Some of the examples identified in the Pensacola aerial included fine areas of smooth surface water in Escambia Bay and swatches of flat grassland. Texture increases with variation on the ground cover, such as areas within Pensacola Airport, to coarse areas of timber land located toward the bay front. The roughest areas of texture include subdivisions with the mixture of house footprints and tree canopies.

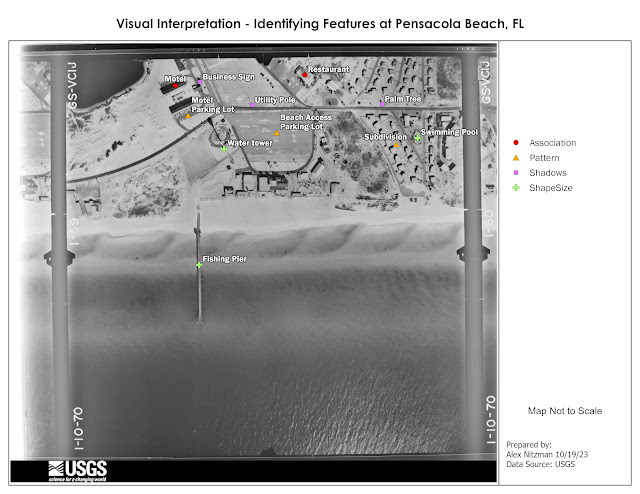
Next to consider when it comes to identifying features on an air photo are aspects of shape, size, pattern, shadows and association. Shape can be a dead give away in some instances, such as the Pensacola Beach fishing pier (one long since replaced due to hurricanes), with its linear appearance on the following aerial.

Identification by Size, Shape, Pattern, Shadow and Association
Shadows often provide insight into what an object may be, such as the Pensacola Beach Water Tower. Looking closer, smaller objects are indefinable based upon their shadow, such as palm trees because of the distinct shape of their fronds.

Like many things in life, appearances on the ground often result in a pattern, or a series of patterns. Striping for a parking lot creates a pattern of linear or angled spaces. A subdivision usually has some uniformity in the placement of houses and their orientation to each street.

Depending upon the area and prior knowledge, a more difficult element of visual interpretation is association. Association is highly variable and references the related surrounding of an object or activity.

Located north of the water tower, the association of the two linear buildings, adjacent parking areas and a swimming pool in between conveys that collectively the site is a motel. A likely restaurant is identified at the north end of the aerial photo based upon the association with the large parking lot and assorted vegetation immediately surrounding the building.

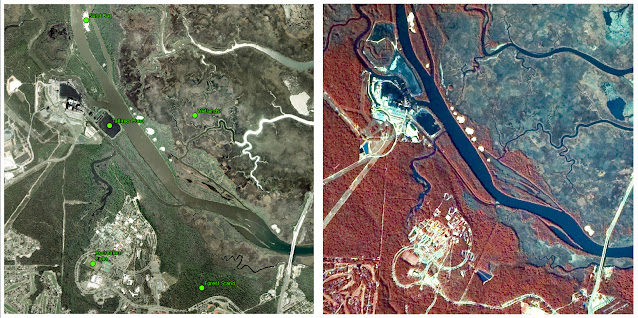
Lastly for this week, we make a comparison of a True Color aerial photograph and False Color or Near Infrared (NIR) aerial photograph.

True Color and False Color Air Photo Comparison

The True Color imagery of the University of West Florida campus and points north along the Escambia River shows the landscape under natural light, or what is visible with the naked eye. False Color is sensitive to near infrared and shows areas where more infrared energy is reflected with shades of red. By separating green, red and NIR bands, and applying a unique color for each, this allows one to more readily distinguish types of vegetation.


Friday, October 13, 2023

Bobwhite Manatee Transmission Line Analysis - Final Project

The final project for GIS4043/Intro to GIS conducts analysis on the Bobwhite Manatee Transmission Project in Southwest Florida. Part of the Florida Power & Light (FPL) infrastructure, the 24.5 mile long transmission corridor was developed to serve growing areas of eastern Manatee and Sarasota Counties, including Lakewood Ranch. Additionally the new line offers redundancy during hurricanes, something tested since it was completed with Hurricane Irma in 2017 and Hurricane Ian in 2022.

GIS analysis was used in part to determine the optimal location for the proposed transmission corridor. The design of the route took considerations for reducing impacts on sensitive or protected conservation land, avoiding schools and daycares, and providing a buffer from existing homes. Community input factored heavily with the corridor ultimately selected. FPL also worked with Schroeder-Manatee Ranch (SMR), the developer of the Lakewood Ranch community, to select a route that preserves the natural beauty of the area.

The study area was 273 square miles wide, mostly spread across central Manatee County along with a portion of northern Sarasota County. The project was announced by FPL in June 2006. With input from a community advisory panel, open house events and surveys mailed to area residents, FPL developed formal plans, which were unveiled in October 2006.

The Bobwhite Manatee Transmission Line project was eventually certified by the Florida Department of Environmental Protection. It subsequently cleared the Transmission Line Siting Act and was approved by the Florida Cabinet and Governor on October 28, 2008. Construction was anticipated to begin in 2010. It ultimately did in 2013, following additional compromises made between FPL, SMR, area homeowners and Taylor & Fulton, an area agricultural group.

Our project looks at four criteria analyzed by GIS for the selection of a preferred corridor for the transmission line. The first objective considered the number of homes and overall properties within proximity of the corridor.

Using the buffer geoprocessing tool, a 400-foot buffer was created around the preferred corridor of the planned transmission line. A feature class locating all homes within the corridor and associated buffer was next created with heads-up digitizing using 2006 aerial photography. With all visible homes added to GIS, running the "select by attribute" geoprocessing tool on created fields that indicated if a home was either within the corridor or within the 400-foot buffer, provided the totals. A map output of the homes and parcels intersecting the corridor:


The transmission line that was eventually built comes no closer to 600 feet from an existing home. No doubt GIS aided in achieving this buffer.

The second objective of GIS with the Bobwhite Manatee Transmission Line project was a simple one. Are their any schools or daycare centers within the preferred corridor, or the associated 400-foot buffer? Some work outside GIS was required to analyze this, as point feature classes for schools and daycares did not exist.

Researching area schools with the Department of Education website, and other websites for daycares falling within zip codes that crossed the preferred corridor, lists were compiled in Excel. These were in turn geocoded into GIS, using more recent street centerline files to complete address matching for automating the location process.

With school layers compiled, the select by attributes geoprocessing tool determined that no schools or daycare centers were within the preferred corridor or buffer:

That fact that FPL avoided all schools and daycares certainly reduced community opposition to the overall project.

Moving on with the analysis, environmental impacts to both conservation areas and wetlands was considered. National Wetlands Inventory (NWI) and Florida Managed Lands data were provided. The question to be answered is how many acres of each land type was within the preferred corridor?

For wetlands, the NWI feature class was clipped within the preferred corridor polygon. The result were records for uplands and two wetland types, with the Shape Area field providing the areas in square meters. After converting the values into acres, calculating the total acres of uplands and wetlands was easily achieved using the Summary Statistics geoprocessing tool.

Conducting spatial analysis on the conservation areas, a different approach was taken using the Select by Location geoprocessing tool with the Intersect relationship. This extracted all polygons in the conservation land feature class that were within the preferred corridor into a new feature class. The resulting data revealed that relatively small portions of a conservation easement, watershed and state park were in the preferred corridor:


The final objective analyzed by GIS was to estimate the total length of the then-future transmission line, and to use that figure in an equation to estimate construction costs. This was a straightforward process using the Polygon to Centerline geoprocessing tool.

However one data discrepancy occurred with the creation of the centerline feature class. The centerline split into separate branches within the triangular shaped wedge at the south end of the preferred corridor. I considered these to be outliers when it came to the determining the overall length of the transmission line.

One option was to take an average of the length between the two and consider adding that to the main centerline vector. Another option was to omit them entirely, as the project included constructing the Bobwhite Substation within that wedge shaped area.

GIS analysis determined an estimated total length of 24.76 miles. An East County Observer news article on the Bobwhite Manatee Transmission Line in 2013 referenced the line being built at the time as 24.5 miles in length. So this was a pretty good result from GIS.

Living in Bradenton from June 2013 to April 2015, I drove by this project several times without knowing much about it. While doing photography for AARoads, I captured work in progress along State Road 64. Looking back at the photos, what was built was a 230kV single circuit transmission line on a steel tubular pole. Using the equation provided with the GIS project documents, that resulted in a rate of $1.1 million per mile. The $27.236 million I calculated was well above the $20 million cost reported in the East County Observer article.

In conclusion, it appears that FPL designed the Bobwhite Manatee Transmission Line with a priority in the feedback from the community. The route was designed to follow existing right of way for several major highways. Using that space instead of a new corridor, the impacts to protected lands was minimized. Beside one home that was eventually demolished to make way for the Bobwhite Substation, it appears as if most existing homes were avoided by the power line.

Wrapping things up, beyond the deliverables posted above, we were tasked with creating a Power Point Slide Show presentation and accompanying transcript. Both are uploaded to my Google Drive:

Tuesday, October 3, 2023

Georeferencing UWF aerials for Eagles nest easement analysis

 The sixth lab for Intro to GIS introduces Georeferencing, which transforms raster data such as an aerial photo or a scan of a subdivision plat, to closely match vector data within GIS. I am familiar with Georeferencing from my cartography jobs, where we often acquired subdivision and other development plats and digitized them for updating map products.

Georeferencing utilizes control points, which match features on the raster image without any location data (coordinate system, latitude/longitude), to an existing vector data set in GIS. There are multiple methods of transformation with Georeferencing. The type of transformation used determines the correct map coordinate location for each cell within the raster data.

A lower order transformation, such as Zero Order Polynomial is used to simply shift data to better line a raster image with vector data. This is often the case if the spatial accuracy of the raster is similar to the vector data, or if the raster image was previously georeferenced and needs slight tweaking of its location to better match vectors. Correcting more complex distortion, higher order transformations allow raster data to bend and warp more.

This week's lab georeferences two aerial photographs of the University of West Florida (UWF) campus to feature layers for campus roads and buildings. I utilized a First-Order Polynomial transformation on the north aerial of the campus. First-Order is used to affine transformation to shift, scale or rotate raster data. Affine is defined in mathematics as "allowing for or preserving parallel relationships", so it more or less in this case scaled the raster image down to match the vector data without much in the way of distortion.

The south aerial of the UWF campus utilized a Second-Order Polynomial transformation. This was due to the aerial being intentionally distorted. Needing at least six control points, second order transformation is used where a raster dataset must be bent or curved to line up with vector data. We used ten control points.

Root Mean Square (RMS) Error was also introduced in this week's lab. RMS calculates the difference between where the from point was ultimately located opposed to the actual location specified. The value describes how consistent transformation is between the different control points. We were looking for RMS values of less than 15, any points exceeding that were beyond the accuracy tolerance.

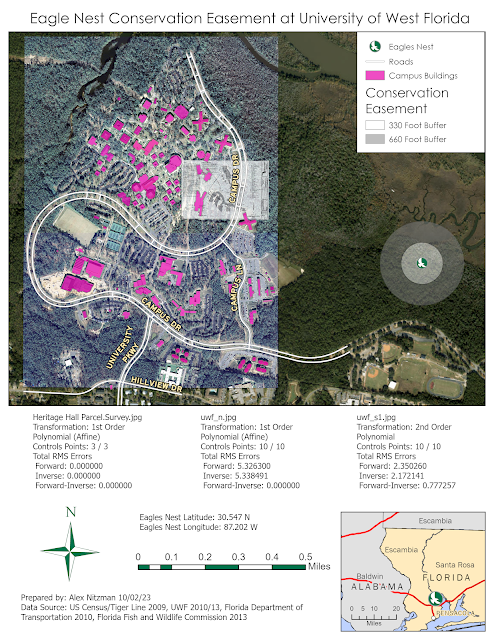
With georeferencing completed, I added a line feature for Campus Lane, a new road constructed since the original data was processed in 2010. I also digitized the new UWF gym, Building 72. With these features added, our next step was to introduce a multi-ring buffer around a nearby Eagles nest, a protected species. Located in an undeveloped area within UWF land to the east, our analysis added 330 foot and 660 foot buffers around the nest location representing two levels of conservation easement. These easements could affect construction of new buildings as part of planned expansion of the UWF campus.

The finished aerial map juxtaposes the existing UWF campus building structures with the conservation easement around the known Eagles nest location.

Aerial imagery and GIS data showing the UWF Campus and and Eagles nest easement


Friday, September 22, 2023

Geocoding Data - Manatee County Schools

This week's lab project introduced me to Geocoding within ArcGIS Pro and some Excel spreadsheet tactics used to prepare the data for it. The focus of this project is to extract the geographic location for Manatee County Schools from the list posted on the Florida Department of Education web site.

Started the lab with a simple copy and paste of the schools list, which includes 84 entries ranging from Charter Schools to Colleges. Added these to an Excel spreadsheet and proceeded to format the data for processing by ArcGIS Pro. The end result were data columns including the school's name, street address, city and zip code.

With the Excel spreadsheet saved as a .CSV file, proceeded into ArcGIS Pro with downloaded TIGER line shapefile data for Manatee County, Florida. The schools list data was then imported into a table.

Geocoding in ArcGIS Pro utilizes either an X/Y location using latitude/longitude, or in the case here, with an address location. First, we needed to compile an address locator file for Manatee County. Using the Create Locator tool, parameters on the TIGER line fields were set for the street name, zip codes right and left for the side of a street segment, and similarly left and right house number ranges. The process ran on the Manatee County line file, creating the Address Locator file needed for the Geocode Table tool.

The Geocode Table tool cross references the Schools input table with the Address Locator file. With our three columns of location data from the original Excel sheet, selected Address, City and Zip as the Data for the Locator Field within the tool. The process creates a geocoded point file of all school locations.

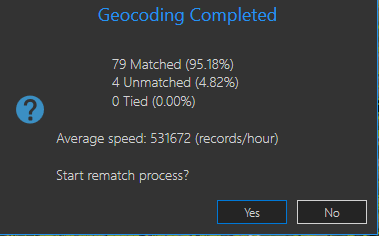
Of the 83 entries within the Schools table, all but four were matched. Those needed further analysis to be located.

One of the entries was located simply by abbreviating "Street" in the address field to "St". Based upon Florida State Road addresses, the remaining three were manually placed by researching their location.

The data entry for Carlos E. Haile Middle School used Fl 64 as the address street name. A problem with this is that often numbered routes have formal names that are used for postal addressing. Furthermore, while FL 64 implies Florida State Road 64, FDOT and other government agencies often instead use "SR" on signing and for addressing.

Two of the schools were addressed as "State Route 70" or "SR 70". The TIGER line data uses 53rd Avenue E in the FULLNAME field for the segment of SR 70 where the schools are actually located. So those schools are misplaced. Contrary to that, two of the original unmatched schools are located along SR 64 in Lakewood Ranch, which the TIGER line data references incorrectly as Manatee Avenue. Manatee Avenue is the formal name for SR 64 within Bradenton. East of there, State Road 64 is the formal name for SR 64 in unincorporated Manatee County.

Data quality is definitely a concern for when it comes to Geocoding. Whether it be an inaccurate address or missing data, these can result in potentially time consuming problems.

Published the final geoprocessed data, showing Manatee County populated with the various school locations, on the webmap at https://pns.maps.arcgis.com/home/item.html?id=c66a66146c024cec9064604c851b0f23. Edited the webmap on September 26 to show a second point layer including the geocoded school list with all locations corrected.

Thursday, September 14, 2023

Map Projection Variation with Florida County data

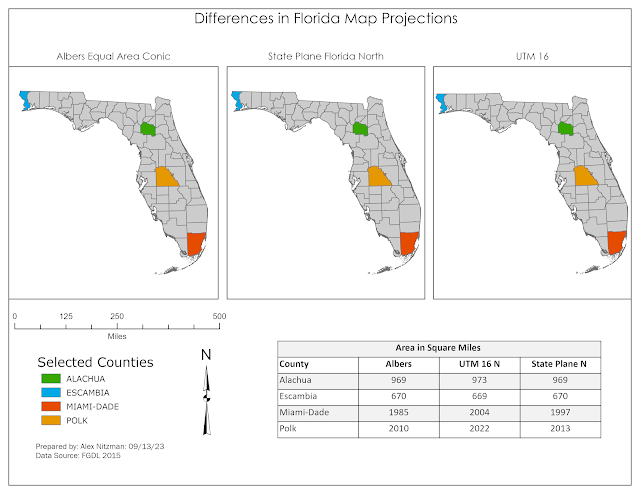
This week's GIS lab delved into map projections, the manipulation of attribute data and the creation of a feature class out of selected data. We were tasked with taking a polygon shapefile of Florida's County Boundaries and reprojecting it from the original Albers Conical Equal Area (Albers) coordinate system to both the State Plane Coordinate System (State Plane Florida North) and the Universal Transverse Mercator (UTM 16 North) system.

Following the completion of that task, we were asked to compare the three maps to note any differences. The Albers and State Plane map projections were very similar, while the UTM projection was noticeably tilted more. Further analysis involved extracting the area in square miles in tables for four select counties across the state. When comparing them, Escambia was nearly identical in area on all three. Alachua was only four square miles larger on UTM 16 N as compared to the other two. More substantial differences were noted in Miami-Dade and Polk Counties, where the square mile numbers for UTM 16 N remained the highest.

Florida County Map in three projections Final map showing Florida with a selected Counties layer in Albers, FL State Plane N and UTM 16 N
Final map showing Florida with a selected Counties layer in Albers, FL State Plane N and UTM 16 N

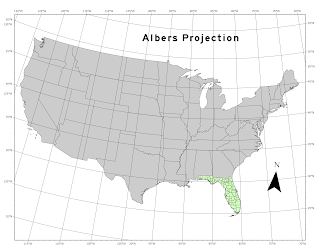
Our process summary included a section to report my results and conclusions. While I knew of the concept of projections from previous cartography work, I really did not know much about the origins of their geographic coordinate systems. So I devoted several hours of research, composing a word document on them for future reference. Followed this by practicing reprojection more and creating overview maps showing each of the three projections nationally with graticules.

U.S. Map reprojected with Albers
With an understanding of their methodology, the differences in the three Florida County map projections become more clear. The original shape file uses the Albers coordinate system, which it turns out is optimal to use for east to west geographical areas located in the mid latitudes. More specifically, the coordinate system uses a two standard parallels to minimize distortion in the region between them. This results in spatial accuracy along the parallels and minimum distortion between them. However scale along the lines of longitude does not match the scale along the lines of latitude, resulting in the final projection not being conformal. Albers is best suited for projecting the entire state of Florida.

There are 60 UTM zones per hemisphere, each spanning 6° longitude with a central meridian located around 180 kilometers between the edges. Best suited for north-south regions, the scale error does not exceed 0.1% per zone. Error and distortion increases for regions that span more than one UTM zone. A UTM zone is not designed for areas spanning more than 20 degrees of latitude.

U.S. Map projected in UTM 16 N
Within this lab, Florida was projected using UTM 16 N, with a central meridian crossing the Florida Panhandle. The entire Florida Peninsula is within UTM 17N. Therefore while the scale error is still minimal, county areas are larger than with Albers or State Plane.

The State Plane Coordinate System divides the 50 U.S. states and associated U.S. territories to over 120 numbered zones. An assigned code for each zone defines the projection parameters using one of three conformal projections. The system is designed with a maximum scale distortion of one part in 10,000 per zone, with a central meridian or standard parallels maintaining this level of accuracy.

The Florida County boundaries layer projected in the lab uses Florida State Plane North, one of three zones assigned to the Sunshine State. This zone uses Lambert Conformal Conic projection, which is best for middle latitudes, as long as the range does not exceed 35°. Similar to Albers, Lambert portrays shape more accurately than area. Latitude spacing increases beyond the standard parallels, with minimal distortion near them. Scale is correct along the standard parallels, but reduced between them and increased beyond them.

U.S. Map projected in State Plane Florida N

The Florida Peninsula generally falls within Florida State Plane West or East. Alachua County represents the eastern extent of the North zone, so the area is accurate. Polk and Miami-Dade are located in the other zones, and therefore are scaled slightly higher due to being beyond the standard parallels for Florida State Plane North.

Florida State Plane East and West both use  Transverse Mercator projection, as they have long north to south axes.


Monday, September 11, 2023

ArcGIS Field Maps - Tampa area route markers

Three weeks into GIS4043, we were introduced to a package including data collection, ArcGIS Online, Story Maps and ArcGIS Field Maps. While I have worked with ArcGIS Online creating state maps with data from various Departments of Transportation for research and write-ups for pages on AARoads, a lot of this was new to me.

The purpose of this week's lab is to create a Feature Class with data collected with a mobile unit using ArcGIS Field Maps. Then with that data, creating a web layer to be shared online by multiple methods.

The initial steps in the lab were to create an empty project and utilize Domains. Domains are predetermined options for data collection in the field. For this project, we were to select an aspect of Public Safety, either within a building complex or in a geographical area.
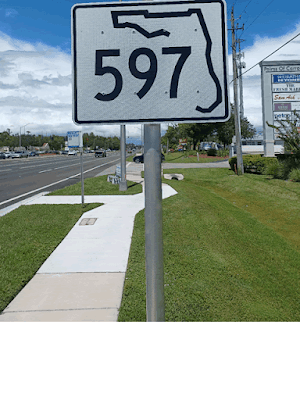
Seeing the opportunity to couple the data collection with an aspect of AARoads, I chose Route Sign Markers as the Public Safety aspect to collect. The clear and consistent marking of numbered routes not only aids in motorist navigation but also indicates that a street or highway is part of a larger system maintained by either the county or state. Clearly marked routes reduce motorist confusion, allowing more attention to be devoted to driving in place of navigation. Poorly marked routes, or ones not marked at all can lead to last minute decisions as far as where to turn or frustration with taking the wrong road altogether.

New Florida State Road 597 marker at Carrollwood
Florida State Road 597 marker in excellent condition
Weathered CR 582A shield on CR 581 south
Faded CR 582 marker in North Tampa
 

Furthermore, GPS based navigation systems such as Google Maps and TomTom devices tend to favor referencing numbered routes over named streets. Therefore having consistently signed route markers working in tandem with street names is better from a motorist perspective. Well marked routes can also aid in hurricane evacuations, keep trucks on designated routes, and provide signed alternates due to congestion on primary routes.

With that in mind, the Domain set up for this lab is "condition", with the field providing options (Code) for excellent, fair and poor. The field type was set to text, and a short description of each Code was entered. This set of criteria works out well with route sign markers, as part of my inspiration for what to collect is because FDOT similarly does field collection where every sign within a district is cataloged in the field and rated based upon its condition.

Following the Domains creation, next was the creation of a new Feature Class that will be populated with the data collected in the field. Having some knowledge of MySQL databases made understanding the need for the Data Type of "Condition" to be set as Text, so it matched the Domain field type set earlier. Other fields added included Photo with the Data Type of Raster and Notes with the Data Type of Text.

With the new Feature Class added to our project Geodatabase, I applied the Condition Domain to the Condition Field. This allows the predetermined Conditions to be used in the field. I then shared the empty Feature Class as a Web Layer with it configured to allow editing. Following a hiccup where the unique numeric ID was not preset (another aspect of MySQL coming into play), the page was published to the Content section of my ArcGIS Online account.

Added the Field Maps application to my Samsung phone via the Google Play Store. Once logged in, data collection could commence! My initial point was a test in the office of a prototype road sign made for me. With the success of that, the next point was within walking distance along U.S. 41.

For the remainder of the points, I wanted a variety of examples allowing me to categorize some signs as fair and others as poor. Knowing where several arrays of such were, my brother, who is a Professional Surveyor, accompanied me as we drove to collect nearly a dozen points. He mentioned Survey Grade collection, which is placing the collection device as close to the data to be cataloged as possible. So I went with that method, placing my phone against each sign support post for the collection.

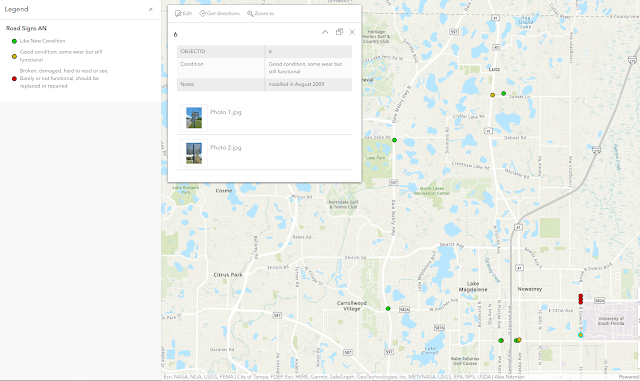
Lutz/North Tampa Web Map
The various route markers we collected throughout the Lutz and North Tampa area


No major difficulty with collecting the points. The only somewhat confusing aspect was that even after touching the Check button in Field Maps to finalize a data point, occasionally the data entry dialog remained. This initially led me to question whether or not the data I entered went through.

Once back at the PC, verified that the data collection was successful on the Web Map on ArcGIS Online. Opened the map via Portal in ArcGIS Pro as well, noting that the pop up information on the software omits the photo thumbnail for each point. Also created a Map Package from the map layer and KML files for Google Earth.

The finished Web Map was posted at https://pns.maps.arcgis.com/apps/mapviewer/index.html?webmap=acd601fc59ab435391f633fe99df7e66