Showing posts with label gis4944. Show all posts

Sunday, November 24, 2024

GIS Portfolio

What a journey it has been in the GIS Undergraduate Certificate Program these last 15 months! As we fast approach the Thanksgiving holiday, the semester is winding down and our final assignment is the compilation of a GIS Portfolio showing some of our best examples of deliverables we produced both in class and professionally.

Me presenting for GIS Day at FDOT District 7
Giving an overview of thematic maps as part of my GIS Day presentation at FDOT District 7

My initial plan was to create an online portfolio on AARoads.com. Avada, the content management system that we use with Word Press on the site, has a built-in Portfolio module. Perfect, or so I thought. A nagging issue with the site has been the depreciating php script that generates the bulk of the guide pages. A customization to Word Press for this script breaks the Portfolio aspect of Avada, and addressing this issue so that it will function properly is not an easy task.

Rather than adding stress to an already busy schedule as of late, I opted to instead compile my GIS Portfolio using PowerPoint. The presentation can be found on my Google Drive at https://drive.google.com/file/d/1I36tE8EkP2LvJoM6Ro2yOl6Xk2r5DMev/view

Alternatively, I also uploaded the GIS Portfolio to AARoads at https://www.aaroads.com/anitzman-gis-portfolio.pdf

Wednesday, November 20, 2024

GIS Day 2024 Event at FDOT District 7

Following months of planning, of which I contributed starting on the second day of my internship, GIS Day is finally here! Beyond brainstorming ideas in which to better spread the word at FDOT District 7 of the event, I was tasked with creating one or two GIS Day maps for display on the wall of the auditorium.

As the semester progressed, I took inspiration from Special Topics assignments and learned skills from Computer Cartography and GIS Applications for several mapping concepts to share on GIS Day. My idea was to show a few examples of the capabilities of GIS, both from an analytical standpoint, and also in the different ways data can be visualized.

After reading several classmates discussion board posts on presentations they made for GIS Day, I decided to follow their lead and create a presentation of my own. My goal was to provide an overview of maps in GIS, then cover each of the five maps I created with a mix of technical information such as the geoprocessing that went into it or the type of map (choropleth, graduated symbol), principles of design, and inspiration for the map subjects.

Our efforts paid off, and the D7 GIS Department's three hour event this morning was a great success! We had around 30 attendees, many of which stayed for all presentations, and received several positive comments on the event. My presentation went over well and I thoroughly enjoyed sharing some of the GIS knowledge gained from my time with the University of West Florida.
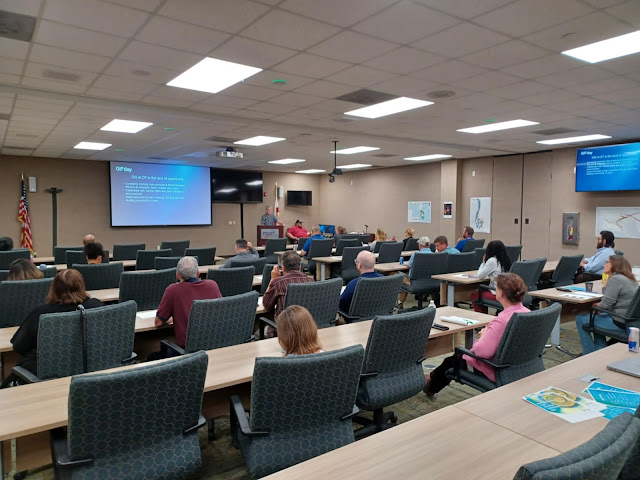
The start of 2024 GIS Day at FDOT District 7
2024 GIS Day at FDOT District 7

My GIS Day 2024 presentation and the maps I created for the event follow:

D7 GIS Day Map Overview

There are two general categories of maps, Reference maps and Thematic maps. We are all familiar with Reference Maps, such as a road map or a political map. On display in the auditorium here are examples of Thematic Maps, which are maps that focus on a specific theme, such as climate, population, or in our case, transportation. This leads me into our first GIS Day map…

Hurricane Tracks Map
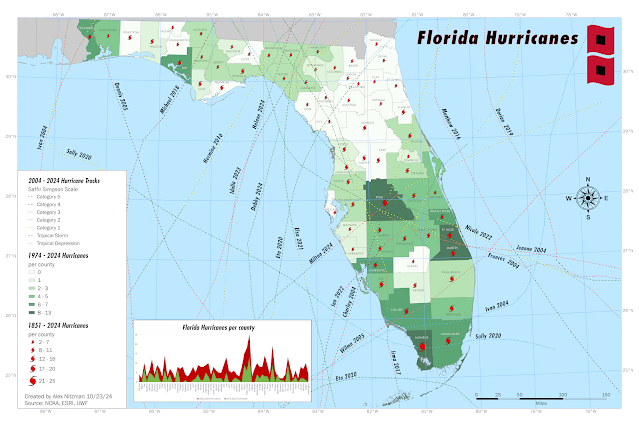
Map quantifying the number of hurricanes striking Florida from 1851 to 2024
Florida Hurricanes quantifying direct impacts from 1851 to 2024

When we were planning our GIS Day event, one of the map concepts discussed was a Florida map of hurricane tracks impacting the state over the last 20 years. Sounds simple enough, but as the map was in production, Hurricane Milton formed, and one fact mentioned by media outlets was that Tampa had not been hit directly by a major hurricane since 1921.

This ultimately factored into me deciding to expand upon the hurricane tracks map concept to quantify the number of hurricanes that have directly passed, the center that is, over each county in the state.

I opted to cover two sets of temporal data. A choropleth map shows the number of hurricanes per county in the last 50 years. It uses dark colors for higher values, conveying that higher values have a heavier visual weight. The graduated symbols map, which quantifies the number of hurricanes per county since 1851, the first Florida hurricane in the dataset, correlate size of the symbol with quantity, i.e. larger means more.

As for how the map was created, the geoprocessing for the choropleth and graduated symbols maps were based upon the number of hurricane polylines crossing any part of the county polygons. These calculations are automatic in GIS and no manual comparisons are needed.

D7 Interstates History Map
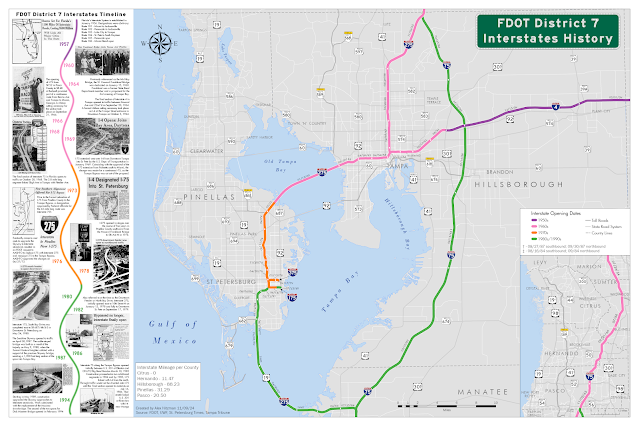
Map showing the opening dates of every mile of the Interstate system within FDOT D7
FDOT District 7 Interstate opening dates color coded by decade

This thematic map aggregates sections of the District 7 Interstate system by the decade in which they opened to traffic. This also shows how the use of graphics can enhance the presentation of a map.

I also factored into the design the Gestalt Principles of Perceptual Organization, which in cartography includes Visual Hierarchy, where important features are emphasized, and less relevant ones deemphasized. The Figure-Ground relationship accentuates certain objects over others by making these appear closer to the map user. Visual Balance is where the size, weight and orientation of map elements are adjusted to achieve balance in the center of the map. Contrast and Color are other principles used in good map design.

D7 Lighting Raster Map
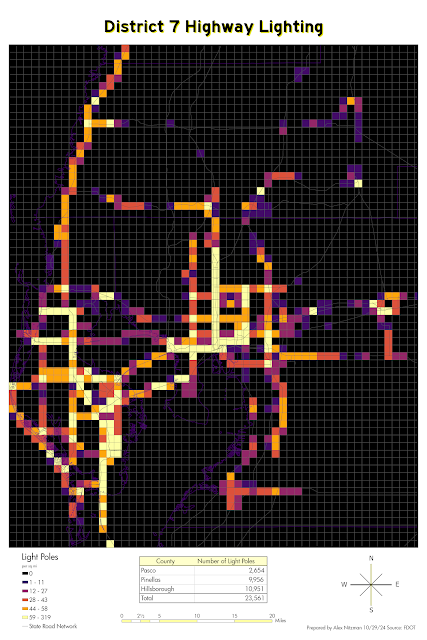
Raster showing the number of light poles per square mile in FDOT District 7
Raster quantifying light poles in FDOT District 7

I created this map to show how raster data can be used by GIS. The concept took the point feature class for all light poles within District 7 and overlayed them with a fishnet grid in ArcGIS Pro. This is also referred to as grid-based thematic mapping. I aggregated the light poles by 1 square mile grid cells and obtained a density unit via geoprocessing. I then symbolized the raster set where lighter colors convey more light fixtures. The end result is a map clearly showing where we maintain the most lighting.

D7 Storm Surge Map
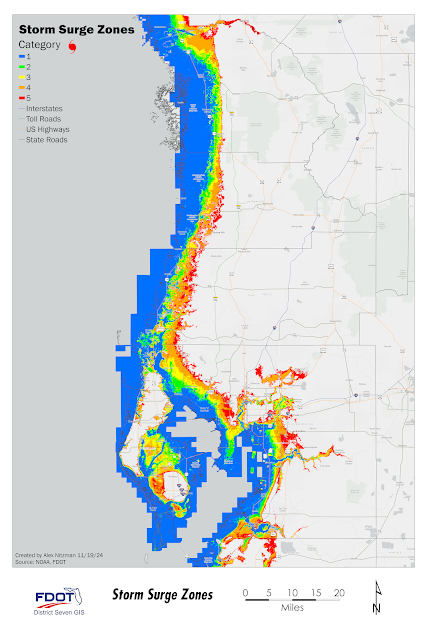
Storm Surge map for FDOT District 7
Areas in FDOT District 7 inundated for storm surge by Saffir-Simpson category

Storm surge data is another form of raster data. These are generally calculated by the use of a Digital Elevation Model or DEM. One useful aspect of ArcGIS Pro is the ability to use geoprocessing to convert a raster into a polygon feature class, such as was done here with this NOAA storm surge dataset.

This expands the options for the GIS analyst. Among others, geoprocessing options include least cost path analysis, buffer analysis, and data interpolation, where unknown values between known data points such as rainfall rates, can be estimated.

3D Traffic Count Map
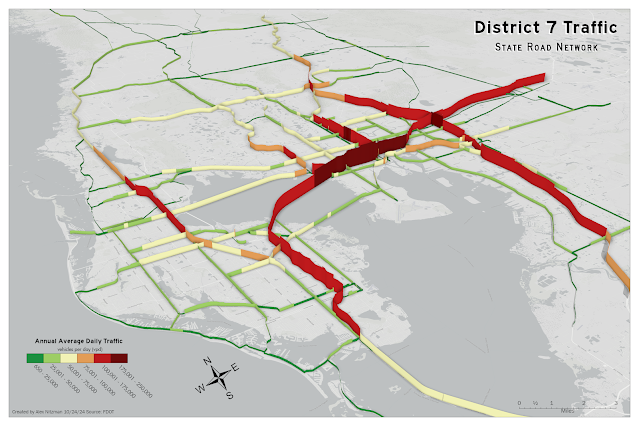
3-Dimension map of traffic volume (AADT) for FDOT District 7
3-Dimensional representation of traffic counts (AADT) on the FDOT D7 state road system

When you think of 3D mapping, you probably think of modeling buildings or terrain, but there are several other uses. One such concept of 3D mapping is to visualize 2D data in a different, and perhaps more thought-provoking way.

That was the idea behind this 3D traffic count map of District 7. ArcGIS uses the Extrusion method to add a 3D element to our 2D feature class. Extrusion bases the height of data on a Z-unit, where the unit can be based upon real-world units, such as the height of a building, or upon ranges of data, such as with the traffic counts here.

ArcGIS Pro renders data three dimensionally differently for points, polylines and polygons. Points will appear as columns. Polylines will appear as a wall, as it does here, and Polygons appear as solid objects, which is probably easiest to imagine when applied to a building footprint.

One thing revealed with this 3D traffic count map was that a stretch of traffic count data for Interstate 4 was missing. So, the 3D map produced an unintended benefit, revealing a section of missing data that we could correct.

So, as you can see, GIS allows you to show geospatial data in a more meaningful way. And these maps are only the tip of the iceberg when it comes to the types of deliverables that can be produced.

Wednesday, October 9, 2024

GIS Internship - Training and Hurricanes

The internship with the Florida Department of Transportation (FDOT) at District 7 Headquarters has been quite eventful. I got started a bit later in the semester through the Volunteer Program, so I am approximately one third through the hours for GIS. Beyond mandatory training for state employees, I got started on putting together a training manual for ArcGIS Pro desktop to be used by the GIS Department in future classes for general employees. I also have partaken in weekly GIS Check-in and GIS Day Progress meetings.

Things changed two weeks ago with the expected development of what became Hurricane Helene in the Northwestern Caribbean Sea. From the beginning the projected path focused on the west coast of Florida and Big Bend region. Either way, the counties within District 7 would be affected, so the focus of FDOT shifted from routine day-to-day operations to storm preparation and emergency management applications.

Additionally the office closed for a couple of days and work-from-home was implemented for most employees. Being an intern, that left me waiting until the following week to resume work. But since I am considered an employee, I could still partake in Microsoft Teams communications from my home PC. So I was able to assist in putting together storm surge inundation graphics for upper management using raster data provided in the NHC Data in GIS Formats downloads page.
NHC Storm Surge Inundation Raster Data for Tampa Bay
Potential Storm Surge Inundation for Hurricane Helene with Florida State Roads

Just over a week removed from Hurricane Helene, Tropical Storm Milton quickly formed within the Bay of Campeche over the southwestern Gulf of Mexico. The initial forecast track immediately targeted the Tampa Bay region. So again the focus at FDOT D7 shifted to emergency management operations and storm preparedness. The biggest difference this time was that FDOT played a role in logistics with relocating the massive amount of debris along the Pinellas County coastline that was the result of Hurricane Helene's storm surge.

The office closed again on Tuesday October 8 and remained close through Thursday. This meant my internship was again on hold, but similar to Helene, I could still contribute GIS related graphics from home. Storm surge being the biggest concern again, I put together another storm surge inundation map with GIS data downloaded from the NHC.
NHC raster data for Hurricane Milton storm surge inundation 10/09/24
Hurricane Milton NHC Storm Surge Inundation for Tampa Bay with Florida State Roads

With the knowledge gained from class, I can quantify this data to show the total mileage of Florida State Roads potentially inundated by storm surge. Then by Calculating Statistics, aggregate the percent of state roads effected by county. One thing I have learned thus far with my internship at FDOT is that the turnaround time for producing a deliverable is often very short. Any premade styling or formatting is absolutely necessary and fine tuning an output map is more of a luxury than a necessity.

10/15/24 Update, after 120 hours of no electricity, water or internet due to Hurricane Milton, I finally have the opportunity to created a LinkedIn profile! While I have known about this platform for many years, my internship and recent classes gave me the impetus for making an account.

My approach to setting up the initial profile was to cover as many aspects of my experiences with Geographic Information Systems (GIS) and geography in general. Barring anymore hurricanes and as I get more time, especially as my internship with FDOT progresses, I will further expound upon my GIS work and classes with my profile.

Sunday, September 15, 2024

Searching for the right GIS job

Finally got started with my GIS Internship with the Florida Department of Transportation at District 7 (D7) Headquarters last week. The position affords me the opportunity to work on several GIS related tasks and with multiple departments. I am working with a great team and providing assistance to others with ArcGIS Pro.

Settling into my internship position at D7 went very smoothly. My initial task is working on a basic training manual for ArcGIS Pro to be used in future courses that the GIS department will offer employees. Additionally I was invited to join planning meetings for this year's GIS Day, which will include demonstrations and information on how various departments across D7 use GIS. I am excited to contribute ideas and provide input, and this will also aid in my eventual GIS Day assignment for GIS4944!
GIS Day - November 20, 2024

One of the assignments for this week in GIS4944 is to conduct a job search for what we could consider to be our Dream GIS Job. Working on road map production for a major mapping company in GIS would be it, but the paper map industry is minimal and becoming more niche. So my second GIS job choice is working in transportation. My positive experiences after two days at FDOT have already reinforced this! 

The job that is most appealing in my search is for a GIS Analyst I for the Texas Department of Transportation (TxDOT). Generally all of the essential duties listed in the job posting fall somewhere within my knowledge wheelhouse. Collecting, preparing and digitizing GIS data is the first listed. Create, maintain, update GIS databases and cartographic products is another duty. Extraction of features from georeferenced scanner paper maps is a third duty that I have experience with. Even the bullet point referencing converting CAD and other formats into ArcGIS formats is a task I likely could master, given previous work with CAD at Mapsource and Adobe Illustrator for AARoads.

The position requires no prior experience, but a Bachelor's Degree in Geography, GIS or a related field is. However, the posting reveals that relevant work experience may be substituted for a degree on a year per year basis. I am confidence I can meet this requirement through my previous work with Mapsource, Universal Map Group, and GIS Cartography & Publishing Services, in addition to our coursework in the UWF GIS Certificate program.

The results of the GIS job search gave me a framework for what to look for in future job searches. The TxDOT position is about as optimum as I could get for both my skillset and interests. A job description for a GIS analyst position with FDOT would likely be similar. However, with ongoing budgetary issues, no positions at FDOT will be posted in the near future. There's always the private sector to consider as well.

Wednesday, August 28, 2024

GIS Internship - Networking in Tampa

The GIS Internship part of the UWF GIS Certification program is something I have looked forward to since the start of classes last Fall. While working on AARoads is rewarding, the lack of a team to work with, especially in recent years, has been increasingly discouraging. Also my previous work with GIS Cartography and Publishing Services (GISCAPS) is 100% remote, so the interaction there is limited to phone calls. Being able to work with others again and contribute to something meaningful was part of my motivation for returning to college.

Over the years I have gotten know several of the folks working at the Florida Department of Transportation District 7 here in Tampa. Ideally I wanted to work with FDOT as my internship. Unfortunately budget concerns precluded the department from offering a formal internship opportunity. However, the window of opportunity did not fully close with District 7, as thanks to research efforts from my brother in Survey and Mapping, it turns out FDOT does have a formal Volunteer Program.

The objectives of the Volunteer Program "is to enhance the delivery of quality services by promoting community involvement in the Department of Transportation, while providing volunteers with a chance to contribute their valuable time and talents." Compensation was not my goal for an internship, instead I  sought the opportunity to further enhance and expand my GIS skillset. While there were some paperwork issues to address and HR related aspects to iron out, I was approved for the Volunteer Program on August 26!

With my cartography background spanning two decades, I will be provided the opportunity to help out multiple departments at FDOT. Some of my duties outlined for the GIS Volunteer program include learning how to create map services, web maps and web applications, reviewing and providing recommendations for symbology settings for GIS layers, and helping draft a training manual for making maps in ArcGIS Pro according to D7 specifications. I will also get to work with the Survey and Mapping department.

This Fall I also registered to attend the GeoFlo Summit, which takes place on November 14, 2024 in Plant City. This will be the second time I have attended the meeting of GIS Users, but first time as an active GIS User! One of the sponsors of the event is the Tampa Bay GIS Users Group (TBGIS). TBGIS regularly hosts Networking Socials, and the next one takes place this evening in Seminole Heights, Tampa. There is no formal membership to TBGIS and everyone in the GIS community and anyone curious about the geospatial world is welcomed to join any of their events. Social media connections and where to join the TBGIS mailing list is at TBGIS Updates.

Thanks to my work with GISCAPS, I was able to attend the ESRI User Conference in San Diego back in 2014. I also attended the FDOT Symposium in 2019. Those were large-scale events, but the premise was the same, being able to meet with and interact with others in the GIS industry. I chose to focus on  TBGIS because they are local and offer in-person events.

Tampa, the city I call home