The final module of Computer Cartography returns us to Google Earth to work with KML (Keyhole Markup Language) files and explore some additional functionality of the software. We previously used Google Earth with data collected using ArcGIS Field Maps and a KML file of point data imported from ArcGIS.
The use of KML files with Google Earth allows us to share geographic data with a general audience that may have zero to little GIS expertise or experience. ArcGIS provides a method to convert a feature class to a KML file with the Layer to KML Geoprocessing Tool. Within ArcGIS Online, it is a simpler process of using the option Export to KML.
Lecture materials for Module 7 cover several aspects of 3D mapping. The videos showed some of the potential advantages of displaying data in 3D and also with using 3D data for analysis. Examples included showing water consumption data in Merced County, California with space-time cubes, where x,y coordinates represent the location and the z coordinates represent time (years). Classified LiDAR data allows a GIS Analyst to interactively make measurements, such as the height of powerlines or an overpass.
Another function in GIS introduced is animations or fly throughs using 3D data. This is further explored in Lab7 with the use of the 3D Mapping component of Google Earth and the creation of a Tour video covering Florida metropolitan areas and cities from the Suncoast to South Florida.
Outside of what was covered in GIS4043, my previous experience with Google Earth mostly comprised using historical imagery to compare archived air photos with more recent imagery. This week's Lab was somewhat challenging in parsing through the Places folder structure and the Temporary Places folder set added during each Google Earth session.
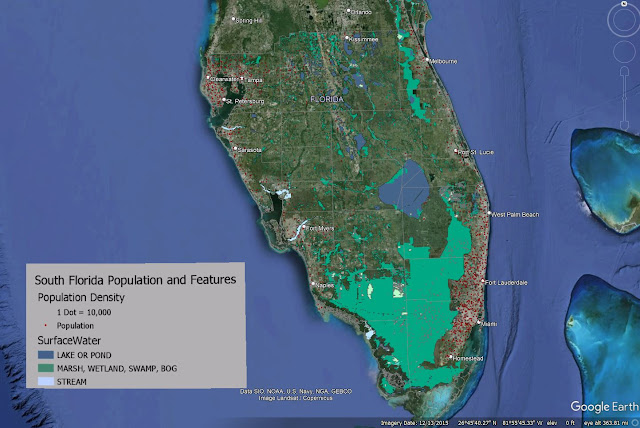
The initial task with the Lab was classifying a provided hydrology feature class and assigning appropriate symbology for water type. This data in turn was converted to a KML for use in Google Earth. Also supplied for the Lab was a Legend .png file and KML files for dot density for population and county boundaries.
All KML files were compiled in Google Earth, but the map legend required manual placement. This was accomplished using the Image Overlay tool, which utilizes a "GroundOverlay" to place an .jpg or .png file. Classmate Michael Lucas made an informative post on the class discussion board about instead creating a a "ScreenOverlay". I was unsure how to accomplish this and opted to edit the XML of the KML file, changing <GroundOverlay> to <ScreenOverlay>. This was somewhat successful except for that the ScreenOverlay graphic was disproportionately large in context. I discarded it for the final output for Lab.
 |
| The KML files and legend used for my Google Earth video tour of South Florida |
With the legend in place, our next task was to create an array of bookmarks for various Florida metropolitan areas and city centers. The bookmarks were in turn used as part of a video tour, where Google Earth starts with an overview of southern Florida, and then proceeds to do fly throughs to the places bookmarked. 3D rendering of buildings in Downtowns were included as part of the tour.
Being that I am somewhat of a novice with the controls of Google Earth, I took the suggestion of using some of the keyboard shortcuts to navigate. Keyboard shortcuts are a must for online gaming, and hotkeys are also quite helpful with familiar software applications. However, usage of keyboard shortcuts requires substantial practice to be overall effective with it. As my video showed, I clearly have room for improvement.
The tour ultimately zoomed into the Miami metropolitan area and panned around Downtown Miami before moving north to Fort Lauderdale and then onto the Tampa Bay area. The video showed some choppiness where it appears I went back and forth with the navigation. This may be a drawback with graphics processing or the software, but those effects exaggerated some of my movements.
A visual aspect of the tour allows one to turn on and off layers as desired throughout the course of the video. Other options I explored included changing the speed at which Google Earth zooms in and out, and how responsive the navigation controls are. Clearly, more improvements can be made, but this goes hand and hand with experience.
My Google Earth files for Module 7 are uploaded to Google Drive:


No comments:
Post a Comment