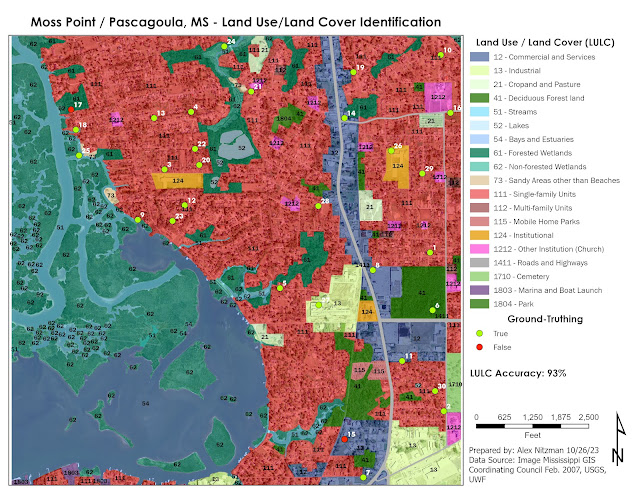
The second module for GIS4035 Remote Sensing/Photo Interpretation introduces the USGS Land Use/Land Cover (LULC) classification system. Originally compiled by James R. Anderson and associates, A Land Use and Land Cover Classification System for Use with Remote Sensor Data was published by the United States Government Printing Office in 1976. There are four levels in the hierarchy, with Level I categorizing LULC on air photos with small scale and low spatial resolution. As Levels increase, so does the detail, corresponding with increases in spatial and spectral resolution and larger scale.
With additional increases in resolution and scale, LULC Level III further distinguishes features from the broader categories. This can be correlated to analyzing data at the city level as opposed to countywide. The numerical system of LULC Classification starts with the first number of code. The small scale categories for Level I are as follows:
- Urban or Built-up Land
- Agricultural Land
- Rangeland
- Forest Land
- Water
- Wetland
- Barren Land
- Tundra
- Perennial Snow or Ice
Representing a subcategory of Level I, Level II utilizes a second digit. For Urban or Built-up Land, 11 represents Residential areas, 12 Commercial and Services, 13 for Industrial areas, etc. Level III expounds classifications in Level II into more distinct categories. So for LULC 11 for Residential, LULC 111 is Single-family units (single family homes), 112 is Multi-family Units (duplexes, townhomes), 113 is Apartment Buildings.
LULC Classification Codes for Level IV can vary, with some states setting their own code structure. Researching codes for Level III and Level IV revealed some of the differences between sets use for
Florida,
New Jersey and
Oregon. Ultimately it appeared that the New Jersey classification scheme seemed to provide the most detailed Level IV data, which provides codes for discrete land types such as cemeteries or athletic fields for schools, areas that may be visually identified at the city level of an air photo.
The lab for this week visually interprets an air photo of western reaches of Moss Point and Pascagoula along the East Pascagoula River in the Mississippi Gulf Coast. The resolution of the air photo was 16 square feet based upon the Stateplane coordinate system used. Based upon this the scale was set at 1:5,000. However after a good discussion during virtual office hours, the Minimum Mapping Unit (MMU) should have been 2 to 4 times greater than the 16 square foot cell size.
With the MMU selected, consistency should be followed. Since I had already analyzed 100% of the map by the time MMU was better explained, I opted to leave the Level III and IV classification polygons I derived from the larger scale.
Part of my analysis with more detail comes from years of studying aerial photography as a map researcher for Mapsource, Universal Map and AARoads. So it was acknowledged that skill sets for air photo interpretation can vary from individual to individual, and that my level of detail was still acceptable for this project.
With the LULC analysis complete, the next task was ground-truthing collection. Since the area of Jackson County, MS is not readily accessible for the class, imagery from Google Maps Street View (GMSV) and other sources of high-resolution aerial photography supplants the in-situ data collection.
Cross referencing the air photo with the historical imagery slider on Google Earth revealed that the photography was conducted in February 2007. This provided the temporal resolution for the ground-truthing exercise. GMSV went online in 2007, and the bulk of the coverage in Moss Point and Pascagoula dates back to 2008.
The majority of the sampling locations corresponded to readily accessible GMSV imagery. There were a few exceptions where some further interpretation was necessary. As for the sampling selection, bias was introduced due to the fact that around one third of the air photo covers areas of open waters or wetland areas outside of the GMSV range. So the extent used for the "create random points tool" in ArcGIS Pro focused on areas mostly inland. A tolerance was set at 16 feet, to provide a minimum distance between sampling locations.
Attempting to use the error matrix discussed in lecture, the LULC accuracy for the 30 points sampled was 93%. The goal of the exercise was general land use and land cover, and my selection of some discrete land use such as schools and churches, added some error potential to the overall accuracy forumlae.


No comments:
Post a Comment