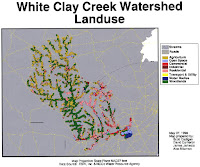
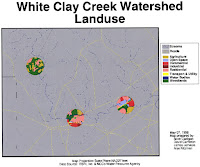
This week's GIS Lab introduced spatial analysis and more specifically, the concept of buffers. Buffers in GIS can be applied to spatial data to conduct analysis on a specifically defined area surrounding the data in question. My last experience with buffers was back in 1998 at the University of Delaware. Our final project then used buffers as part of the analysis for the White Clay Creek Watershed in northern Delaware. Still having the paperwork from my GIS work back then, I scanned some of the maps to show buffers that we used:
Please ignore the lack of a North Arrow and Scale Bar, that was a long time ago!
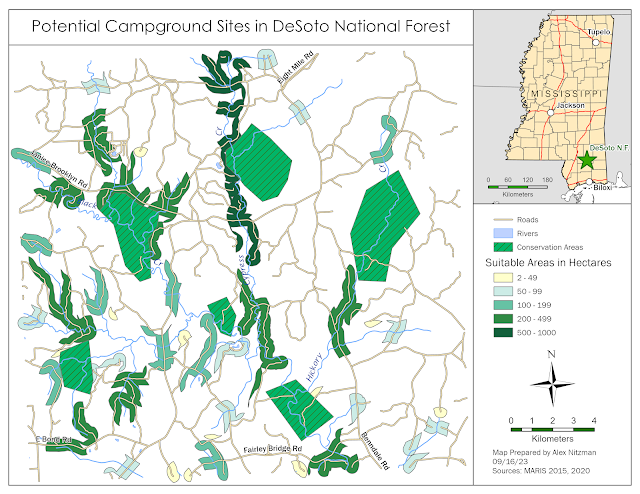
The map to be produced for our Vector analysis lab will show potential campground sites within DeSoto National Forest in southeastern Mississippi. The criteria for a suitable campsite includes locations no more than 300 meters from a road, so that they are accessible by car. Sites should also be within 500 meters from a river for recreational opportunities. However sites should be at least 150 meters from a lake, to offset potential flooding concerns from larger bodies of water. Possible sites also need to exclude areas within conservation areas where plants and wildlife are protected.
Vector data acquired for this analysis includes feature classes for roads across the National Forest, hydro data including both lakes and rivers, and a polygon layer for conservation areas. GIS analysis utilizes a series of buffers on both the roads and hydro data to find areas within optimal range from roads and rivers, but a safe distance from lakes and wholly outside conservation areas.
Initial analysis utilized a fixed distance buffer including all areas within 300 meters from area roads. Dissolving the output feature class for the roads buffer resulted in one seamless polygon in place of separate abutting polygons. Followed this with a variable buffer on the hydro data. First adding a field for buffer distance (buffdist) to the attribute table, I used the Calculate Field function to set a buffdist of 500 meters for rivers and a buffdist of 150 meters for lakes.
Next ran the Geoprocessing buffer tool with the buffdist Field as the distance parameter and Planar as the method since projected coordinate systems were used for the data. The output feature class used dissolved features based upon the buffdist Field. This produced separate polygons for areas within 150 meters of a lake and 500 meters from a river.
With feature classes for roads buffer and water buffer compiled, analysis shifted to overlaying the two. Continued by adding a new field "insd_wbuf" for inside water buffer and "insd_rbuf" for inside road buffer on the respective layers. Both fields were set to short integers, instituting a Boolean expression where 1 equals yes or is True, and 0 is no or is False. Ran the Union (Analysis) Tool on the buffers, producing a new feature class. Polygons varied from "areas within the lake buffer, but outside the road buffer" to "areas within both the river and road buffer."
The resulting layer from the Union Tool assigned areas within both the roads and water buffers as 1 (True) for the insd_wbuf and insd_rbuf fields. Selected those attributes where both fields were set to 1 and exported the features into a new feature class.
Lastly, the conservation areas were excluded from the feature class containing areas within falling within both roads and water buffers. With those areas eliminated from consideration, the final layer showing possible campground sites was nearly ready to be reviewed.
The resulting feature class was a multipart layer, meaning that while the various polygons appeared separate, they were all part of a single attribute record. The Multipart to Singlepart tool partitioned the data into single sites. One last step involved adding the field Area to the final attribute table and calculating the area of each site feature in hectares.
All geoprocessing completed, the data showing areas that fit our criteria for optimal campground locations was ready for presentation. How big is a hectare? 1 hectare is 2.47 acres. So for the symbology, I color coded areas based upon size, with larger areas represented with darker shades of green. Reading that RV parks often require 5 to 20 acres of land, I excluded all areas that were below 2 hectares.
Following a series of several revisions, the final map:


No comments:
Post a Comment