Following months of planning, of which I contributed starting on the second day of my internship, GIS Day is finally here! Beyond brainstorming ideas in which to better spread the word at FDOT District 7 of the event, I was tasked with creating one or two GIS Day maps for display on the wall of the auditorium.
As the semester progressed, I took inspiration from Special Topics assignments and learned skills from Computer Cartography and GIS Applications for several mapping concepts to share on GIS Day. My idea was to show a few examples of the capabilities of GIS, both from an analytical standpoint, and also in the different ways data can be visualized.
After reading several classmates discussion board posts on presentations they made for GIS Day, I decided to follow their lead and create a presentation of my own. My goal was to provide an overview of maps in GIS, then cover each of the five maps I created with a mix of technical information such as the geoprocessing that went into it or the type of map (choropleth, graduated symbol), principles of design, and inspiration for the map subjects.
Our efforts paid off, and the D7 GIS Department's three hour event this morning was a great success! We had around 30 attendees, many of which stayed for all presentations, and received several positive comments on the event. My presentation went over well and I thoroughly enjoyed sharing some of the GIS knowledge gained from my time with the University of West Florida.
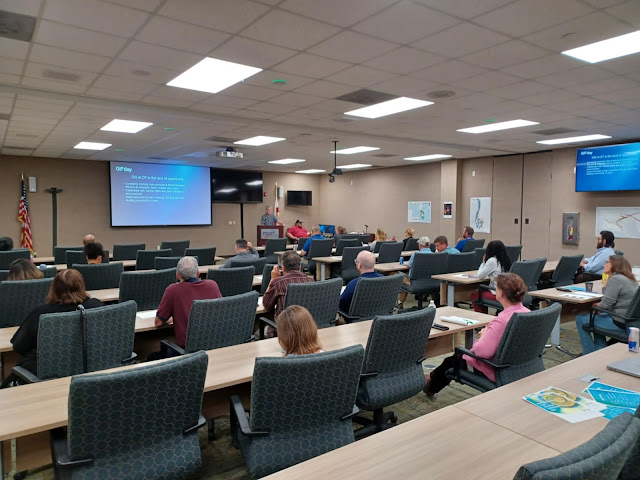 |
| 2024 GIS Day at FDOT District 7 |
My GIS Day 2024 presentation and the maps I created for the event follow:
D7 GIS Day Map Overview
There are two general categories of maps, Reference maps and Thematic maps. We are all familiar with Reference Maps, such as a road map or a political map. On display in the auditorium here are examples of Thematic Maps, which are maps that focus on a specific theme, such as climate, population, or in our case, transportation. This leads me into our first GIS Day map…
Hurricane Tracks Map
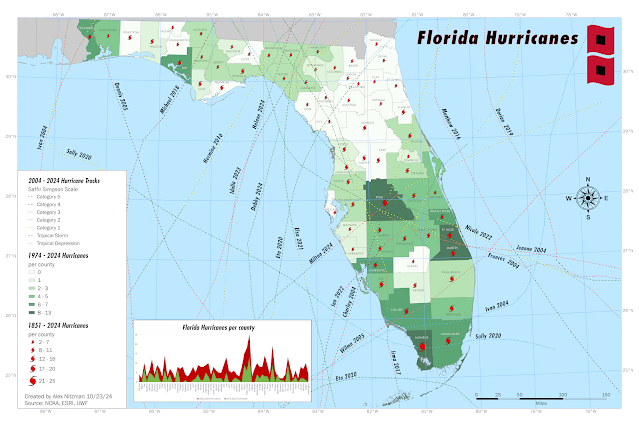 |
| Florida Hurricanes quantifying direct impacts from 1851 to 2024 |
When we were planning our GIS Day event, one of the map concepts discussed was a Florida map of hurricane tracks impacting the state over the last 20 years. Sounds simple enough, but as the map was in production, Hurricane Milton formed, and one fact mentioned by media outlets was that Tampa had not been hit directly by a major hurricane since 1921.
This ultimately factored into me deciding to expand upon the hurricane tracks map concept to quantify the number of hurricanes that have directly passed, the center that is, over each county in the state.
I opted to cover two sets of temporal data. A choropleth map shows the number of hurricanes per county in the last 50 years. It uses dark colors for higher values, conveying that higher values have a heavier visual weight. The graduated symbols map, which quantifies the number of hurricanes per county since 1851, the first Florida hurricane in the dataset, correlate size of the symbol with quantity, i.e. larger means more.
As for how the map was created, the geoprocessing for the choropleth and graduated symbols maps were based upon the number of hurricane polylines crossing any part of the county polygons. These calculations are automatic in GIS and no manual comparisons are needed.
D7 Interstates History Map
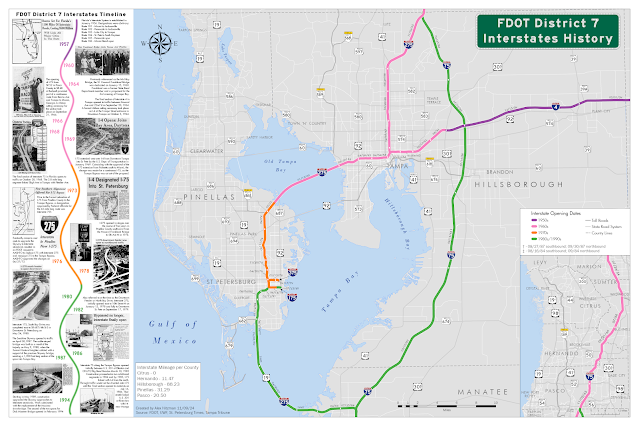 |
| FDOT District 7 Interstate opening dates color coded by decade |
This thematic map aggregates sections of the District 7 Interstate system by the decade in which they opened to traffic. This also shows how the use of graphics can enhance the presentation of a map.
I also factored into the design the Gestalt Principles of Perceptual Organization, which in cartography includes Visual Hierarchy, where important features are emphasized, and less relevant ones deemphasized. The Figure-Ground relationship accentuates certain objects over others by making these appear closer to the map user. Visual Balance is where the size, weight and orientation of map elements are adjusted to achieve balance in the center of the map. Contrast and Color are other principles used in good map design.
D7 Lighting Raster Map
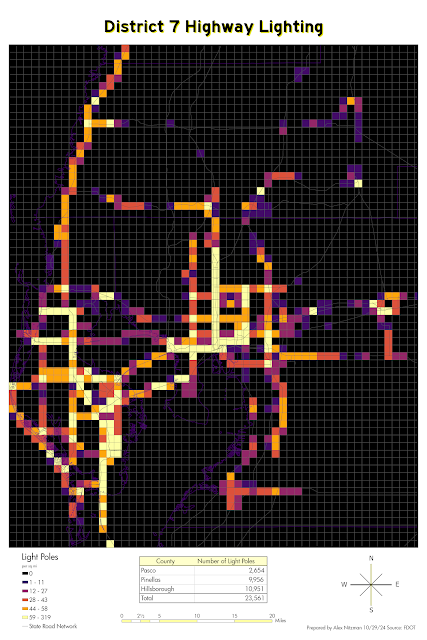 |
| Raster quantifying light poles in FDOT District 7 |
I created this map to show how raster data can be used by GIS. The concept took the point feature class for all light poles within District 7 and overlayed them with a fishnet grid in ArcGIS Pro. This is also referred to as grid-based thematic mapping. I aggregated the light poles by 1 square mile grid cells and obtained a density unit via geoprocessing. I then symbolized the raster set where lighter colors convey more light fixtures. The end result is a map clearly showing where we maintain the most lighting.
D7 Storm Surge Map
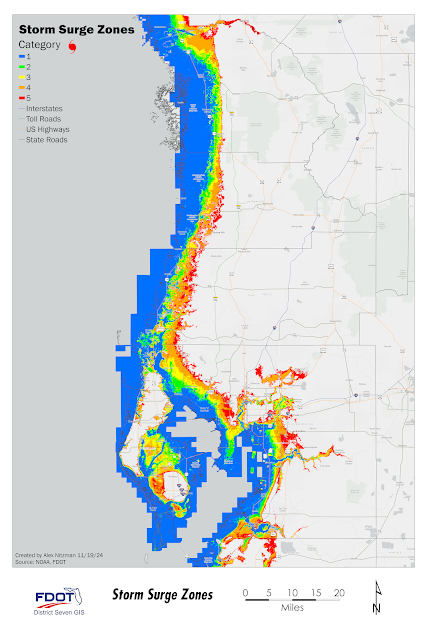 |
| Areas in FDOT District 7 inundated for storm surge by Saffir-Simpson category |
Storm surge data is another form of raster data. These are generally calculated by the use of a Digital Elevation Model or DEM. One useful aspect of ArcGIS Pro is the ability to use geoprocessing to convert a raster into a polygon feature class, such as was done here with this NOAA storm surge dataset.
This expands the options for the GIS analyst. Among others, geoprocessing options include least cost path analysis, buffer analysis, and data interpolation, where unknown values between known data points such as rainfall rates, can be estimated.
3D Traffic Count Map
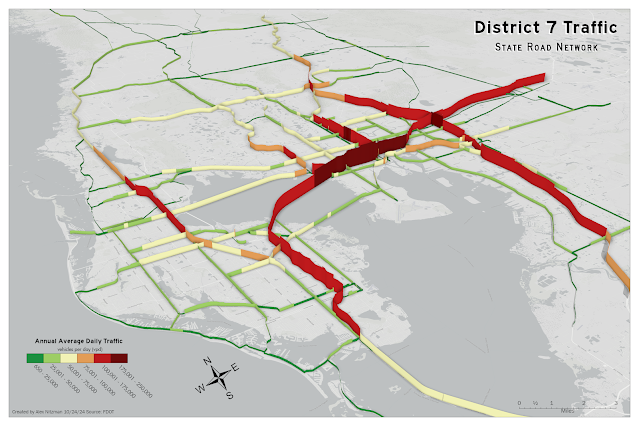 |
| 3-Dimensional representation of traffic counts (AADT) on the FDOT D7 state road system |
When you think of 3D mapping, you probably think of modeling buildings or terrain, but there are several other uses. One such concept of 3D mapping is to visualize 2D data in a different, and perhaps more thought-provoking way.
That was the idea behind this 3D traffic count map of District 7. ArcGIS uses the Extrusion method to add a 3D element to our 2D feature class. Extrusion bases the height of data on a Z-unit, where the unit can be based upon real-world units, such as the height of a building, or upon ranges of data, such as with the traffic counts here.
ArcGIS Pro renders data three dimensionally differently for points, polylines and polygons. Points will appear as columns. Polylines will appear as a wall, as it does here, and Polygons appear as solid objects, which is probably easiest to imagine when applied to a building footprint.
One thing revealed with this 3D traffic count map was that a stretch of traffic count data for Interstate 4 was missing. So, the 3D map produced an unintended benefit, revealing a section of missing data that we could correct.
So, as you can see, GIS allows you to show geospatial data in a more meaningful way. And these maps are only the tip of the iceberg when it comes to the types of deliverables that can be produced.


